1511
CRM & Sales Pipeline Analysis
CRM & Sales Pipeline Analysis
More Report pages
Report Author: Sweety Antoni David
1511
Share template with others
Report submitted for FP20 Analytics ZoomCharts Challenge 17 (July 2024). The report was built with the CRM & Sales Pipeline Analysis dataset and includes ZoomCharts custom Drill Down PRO visuals for Power BI.
Author's description:
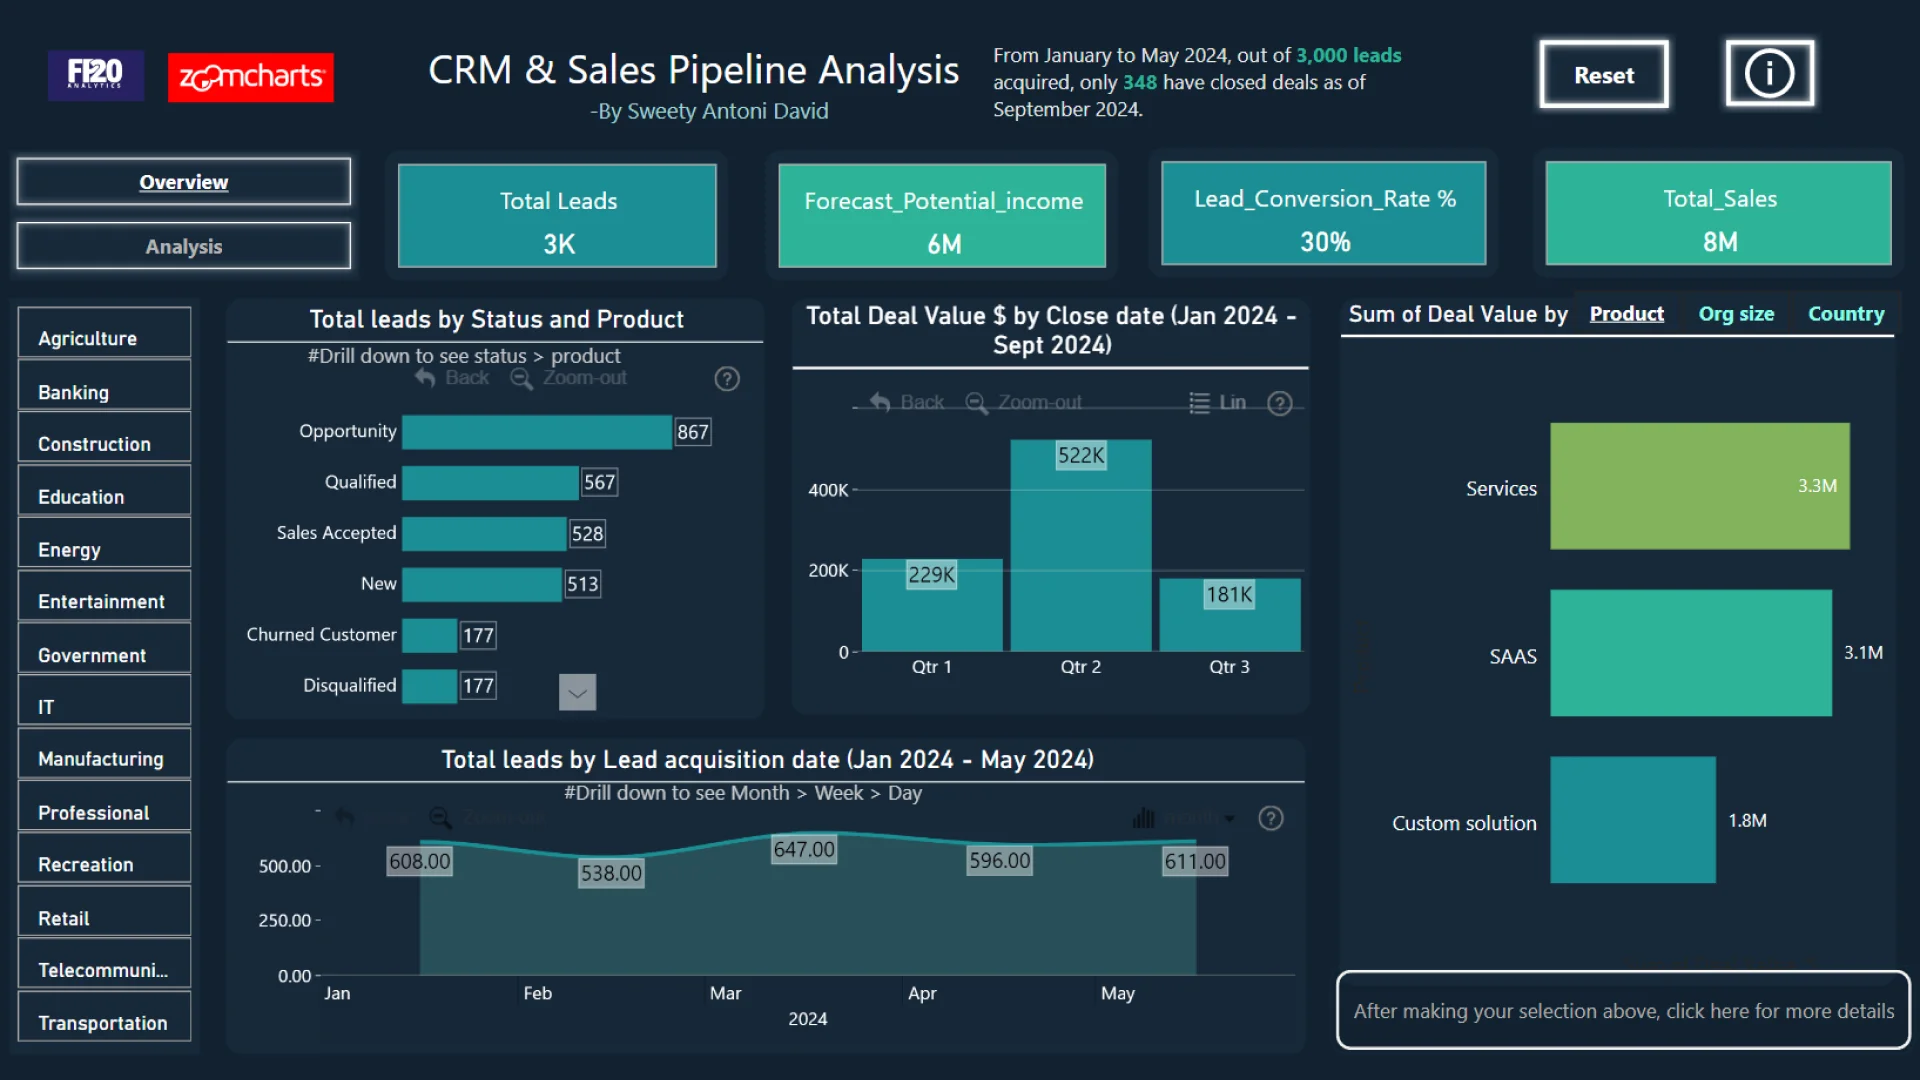
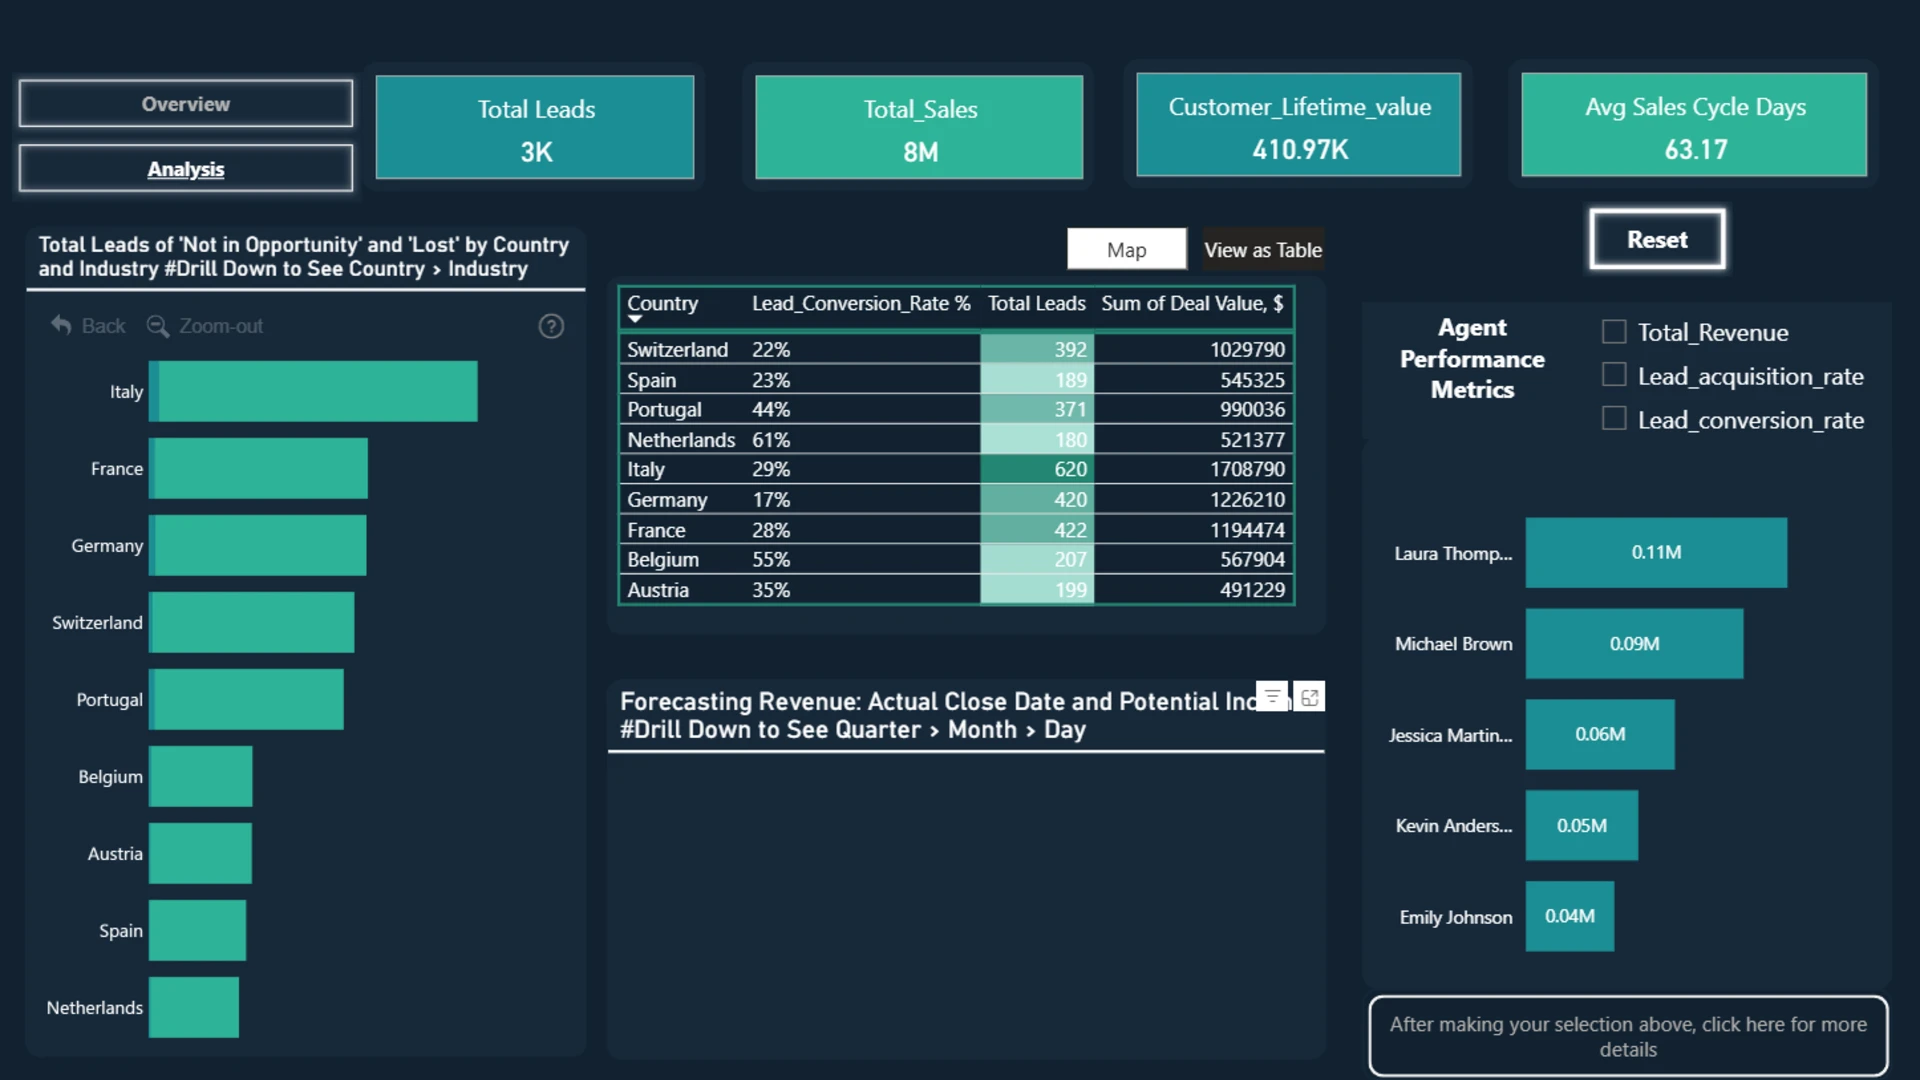
The report for CRM and sales analysis from January to May 2024 reveals significant insights 3,000 leads acquired with 348 closed deals by September 2024. Q2 led with 522K in closed deal value, followed by Q1 (229K) and Q3 (181K). Services and SaaS each contributed 3.1M in deal value, with custom solutions at 1.8M. March had the highest leads at 647. Laura Thompson stands out with 108,913 in total revenue, highlighting her top performance. These insights drive strategic decisions to optimize sales efficiency and maximize revenue growth.
ZoomCharts visuals used
4U Report Challenges
Participate in data challenges, build and submit reports to get free template downloads.
Join CommunityMobile view allows you to interact with the report. To Download the template please switch to desktop view.


Was this helpful? Thank you for your feedback!
Sorry about that.
How can we improve it?