9044
CRM pipeline Analysis
CRM pipeline Analysis
More Report pages
Report Author: Balu Chelluri
9044
Share template with others
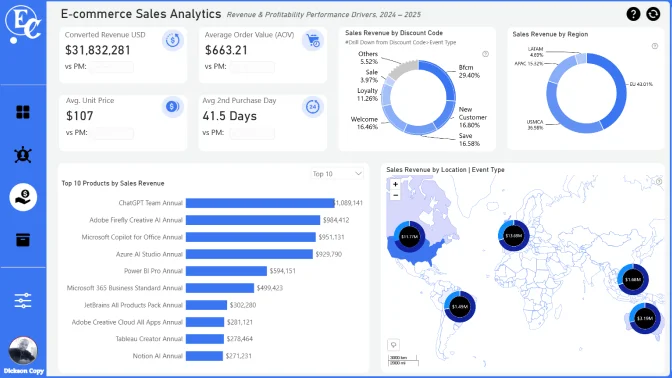
Report submitted for FP20 Analytics ZoomCharts Challenge 17 (July 2024). The report was built with the CRM & Sales Pipeline Analysis dataset and includes ZoomCharts custom Drill Down PRO visuals for Power BI.
Author's description:
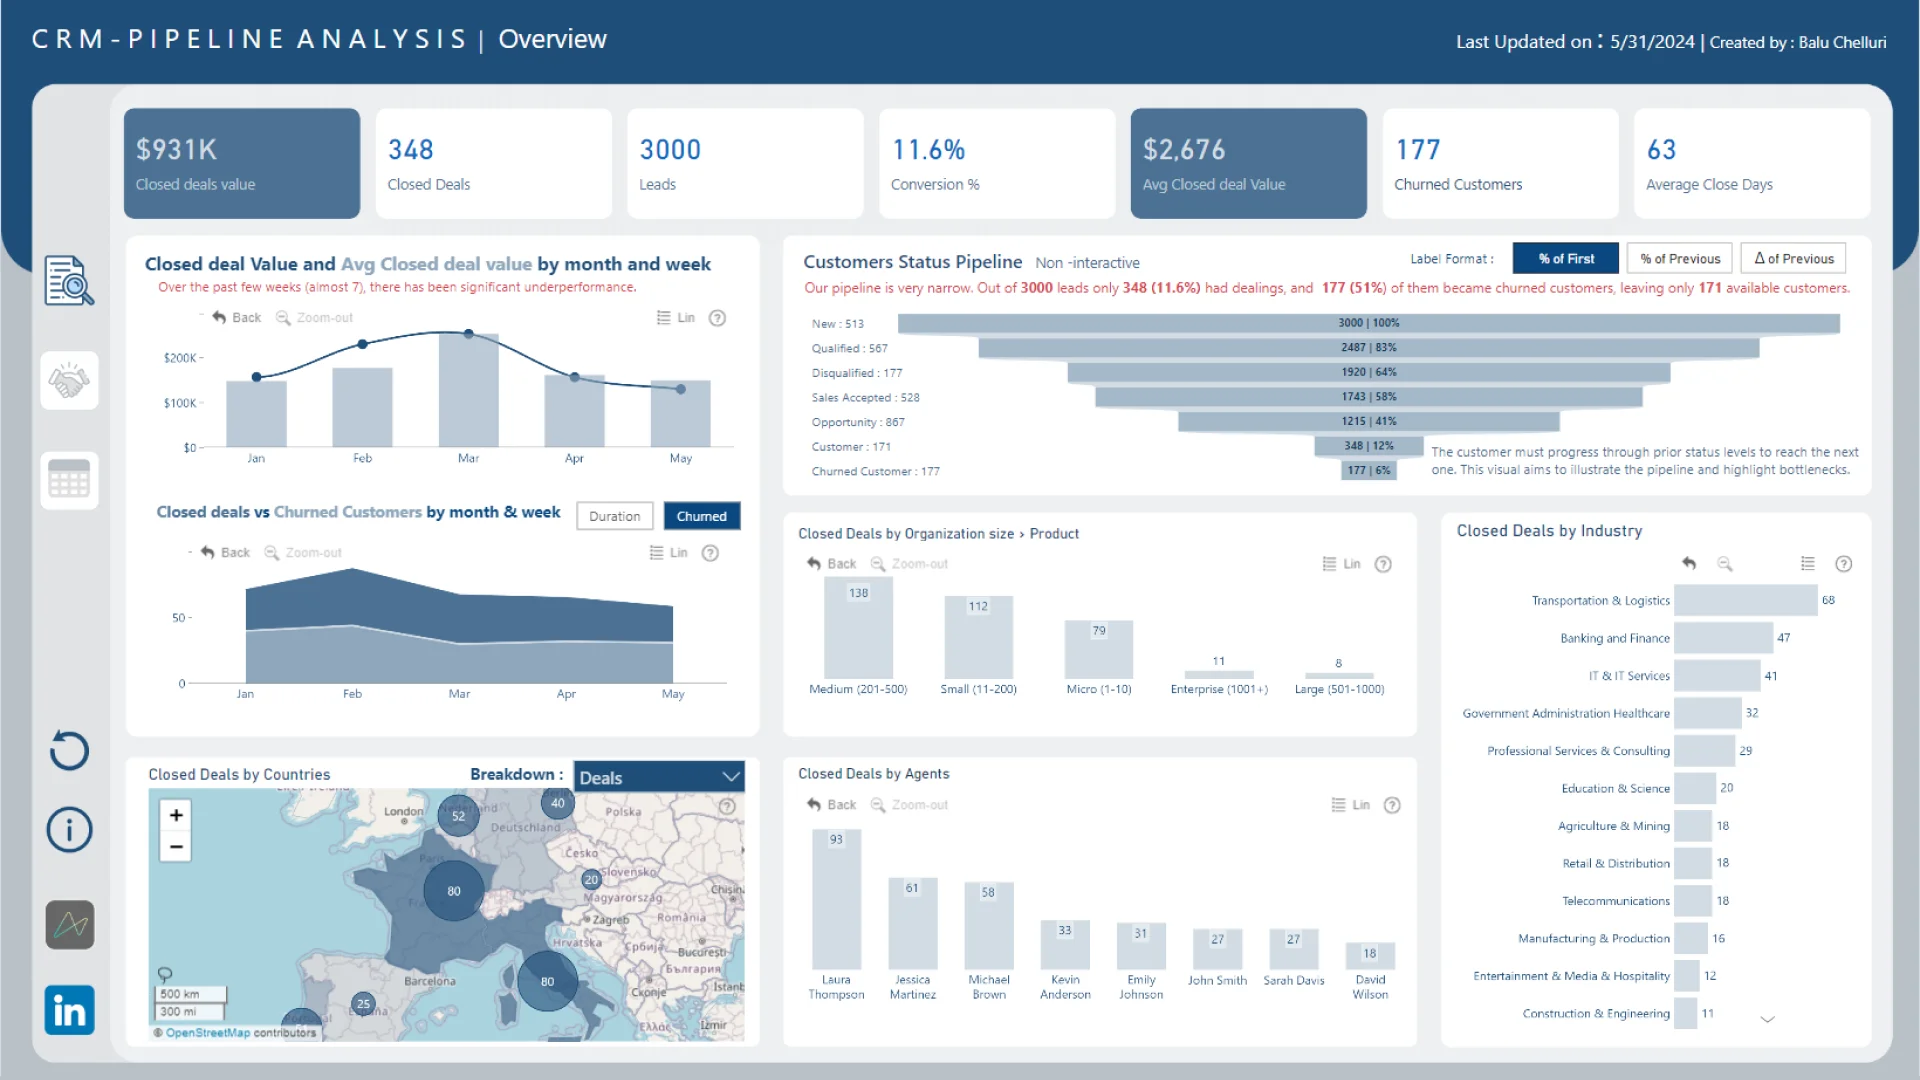
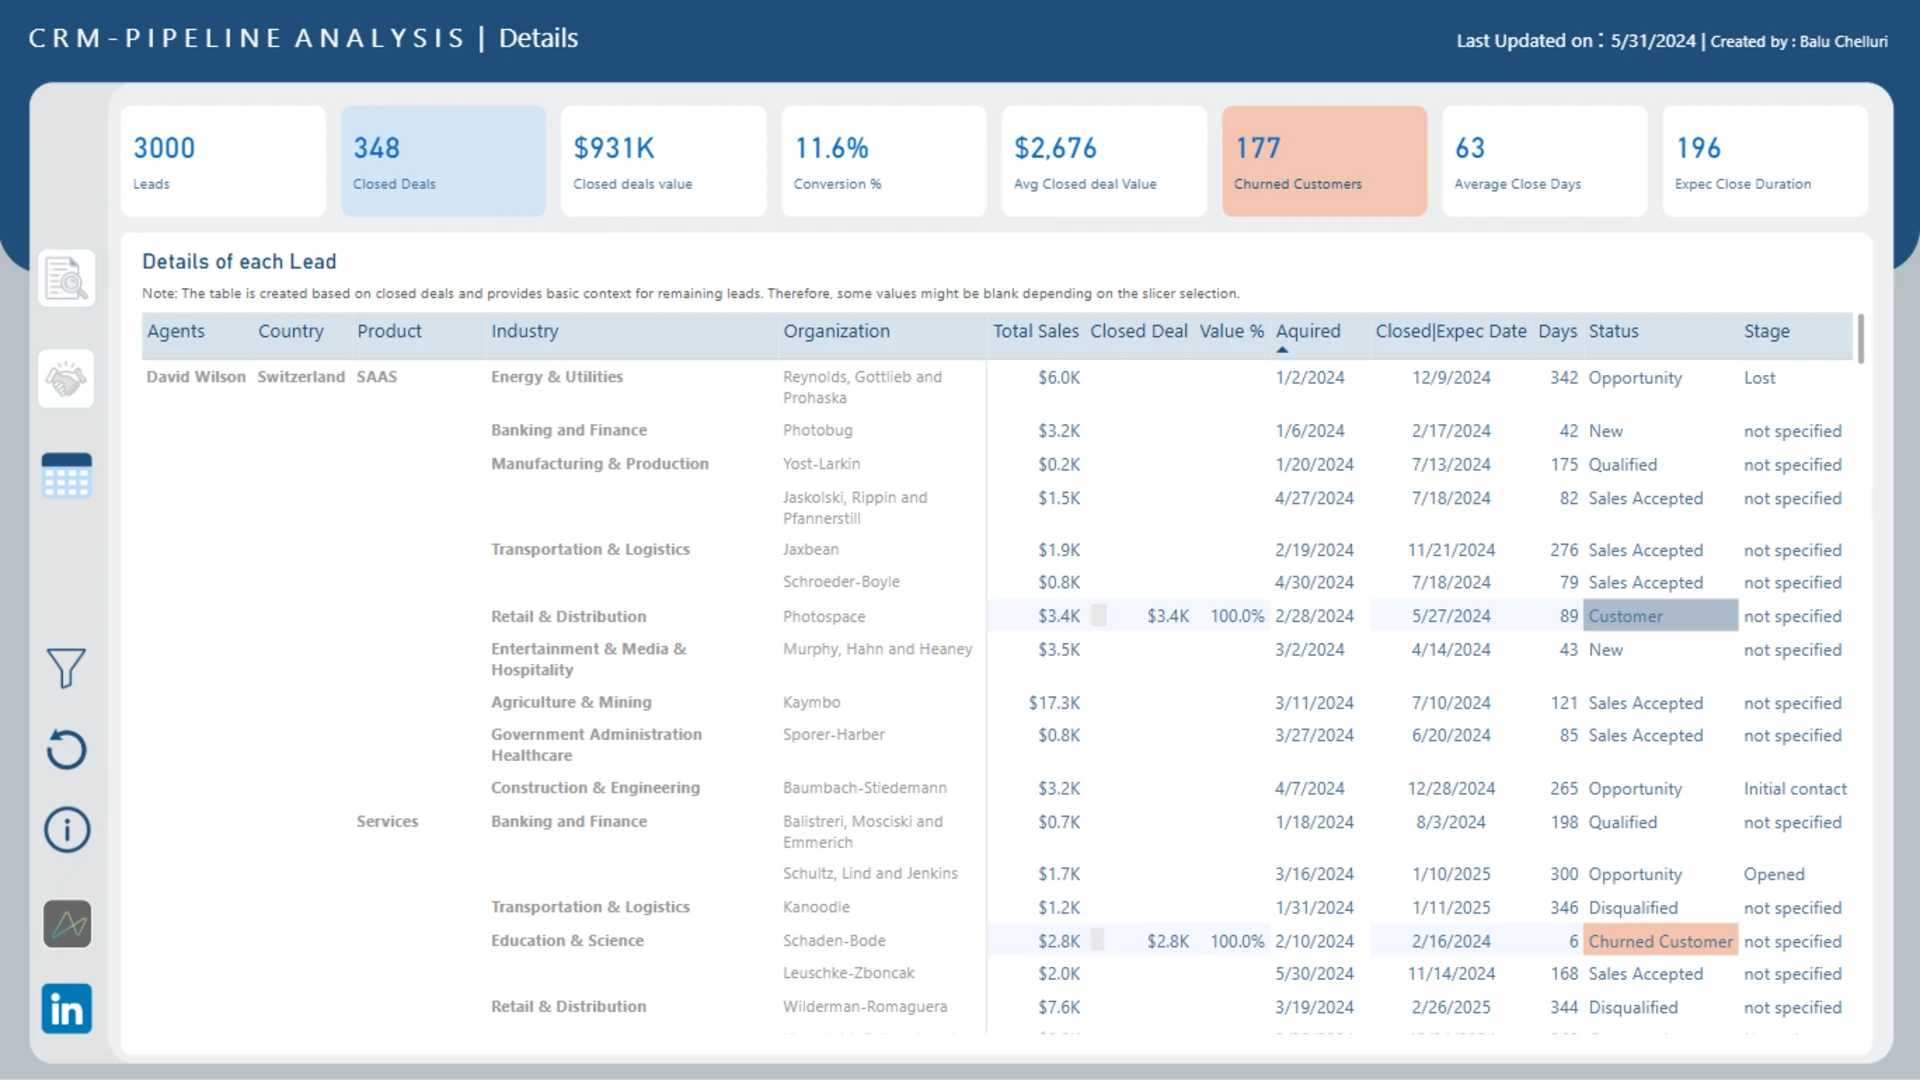
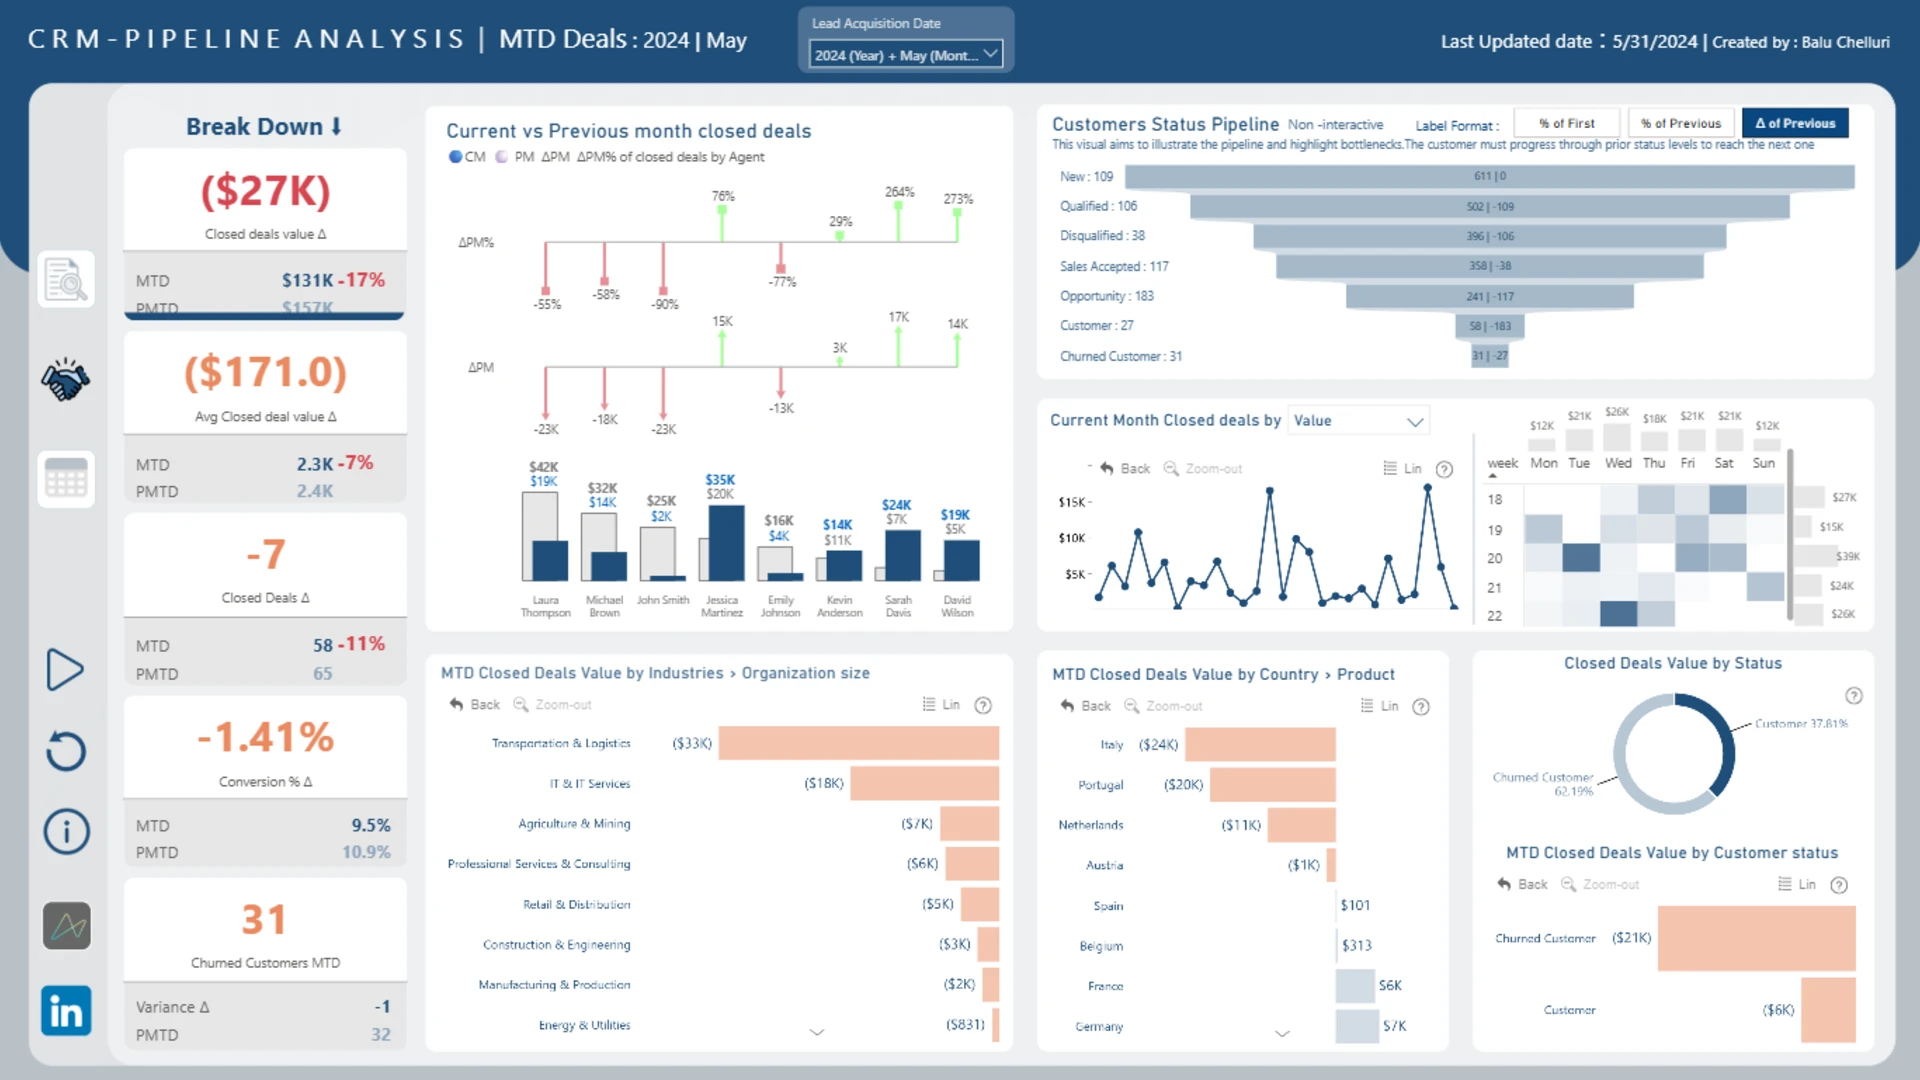
Due to limited information, I decided to prioritize a few requirements and skip forecasting. Therefore, my focus was on recent pipeline performance. I concentrated on two key issues: closed deals and churned customers. After completing data modeling and exploratory data analysis (EDA), I found that most metrics have underperformed in recent weeks. I curated the MTD Performance report based on KPIs, This approach helps us understand selected metrics at a granular level, enabling each team to focus effectively.
ZoomCharts visuals used
4U Report Challenges
Participate in data challenges, build and submit reports to get free template downloads.
Join CommunityMobile view allows you to interact with the report. To Download the template please switch to desktop view.

Was this helpful? Thank you for your feedback!
Sorry about that.
How can we improve it?