230
Consumer Financial Complaints Report 32
Share template with others
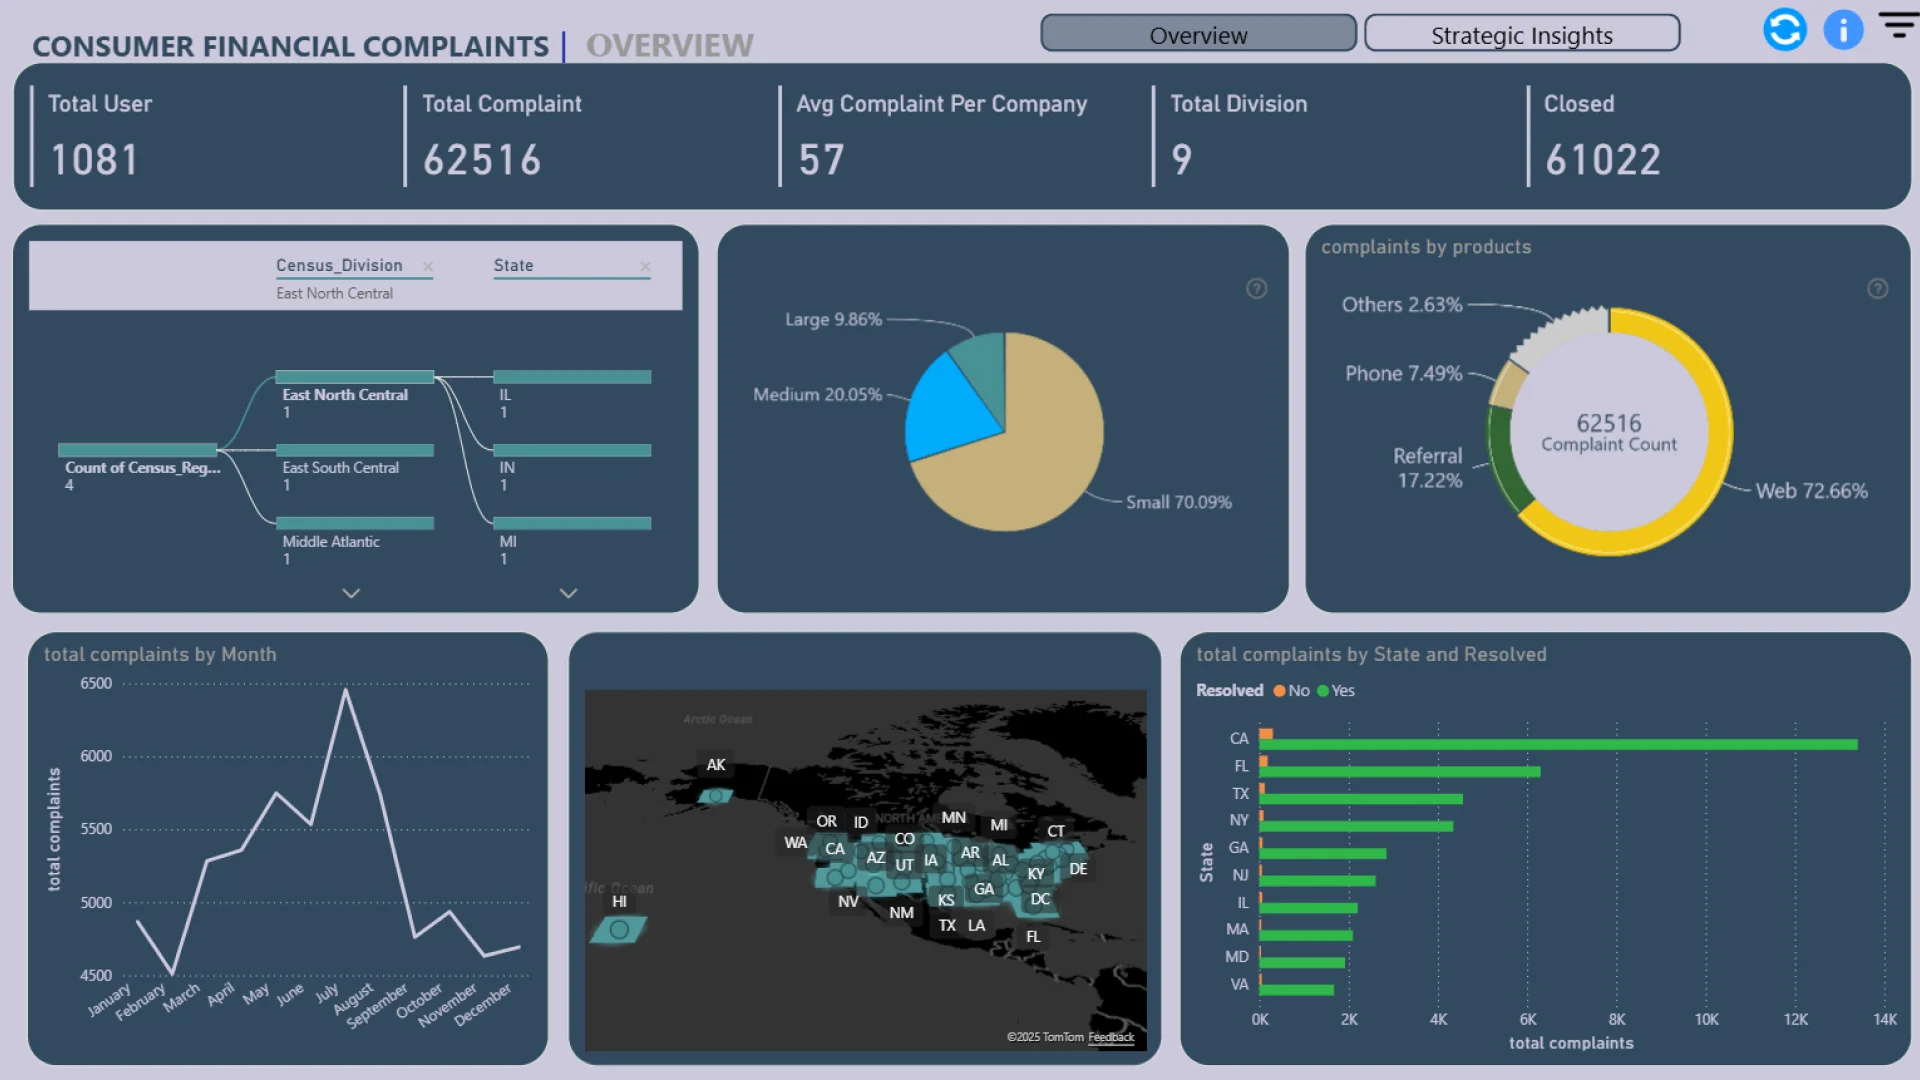
This Power BI report uses the Consumer Financial Complaints Dataset and features ZoomCharts Drill Down PRO custom visuals for Power BI. It was submitted to the Onyx Data DataDNA ZoomCharts Mini Challenge in October 2025.
Author Description:
This dashboard analyzes over 62,000 consumer complaints across regions, company sizes, and product categories. While 97.6% of cases are resolved, a small portion still require further action. The insights point to three key priorities: accelerating initial response times, focusing on high-complaint regions and states, and leveraging chatbots on web platforms to handle early-stage inquiries more efficiently.
ZoomCharts visuals used
Need help?
Send your question to ZoomCharts assistant, and we will respond to you as soon as possible.
Contact UsMobile view allows you to interact with the report. To Download the template please switch to desktop view.

ZoomCharts Academy
Learn ZoomCharts with experts and become certified!
Go to Academy!
Was this helpful? Thank you for your feedback!
Sorry about that.
How can we improve it?

