934
Christmas Sales & Trends Analysis
Christmas Sales & Trends Analysis
More Report pages
Report Author: Larisa Demjanenko
934
Share template with others
Report submitted for Onyx Data DataDNA ZoomCharts Mini Challenge, December 2023. The report was built based on Christmas Sales and Trends dataset and includes ZoomCharts custom Drill Down PRO visuals for Power BI.
Author's description:
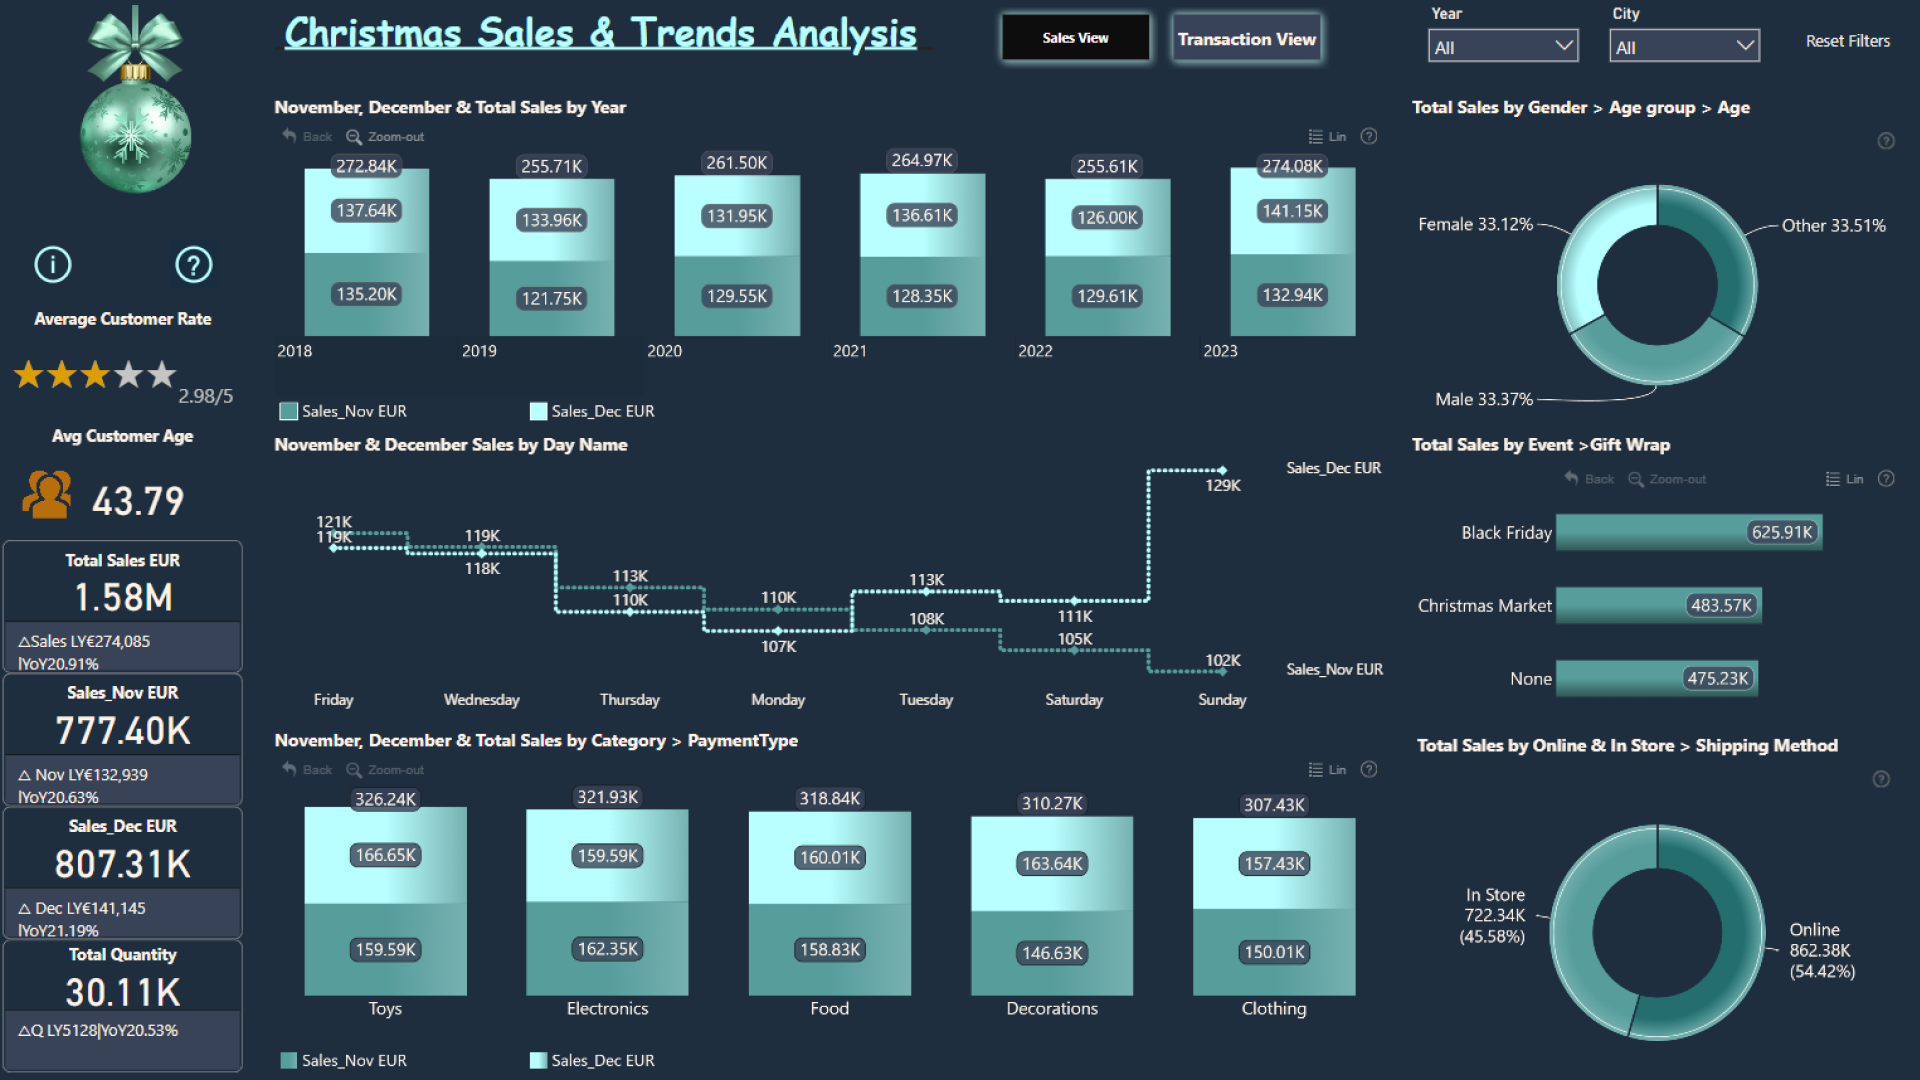
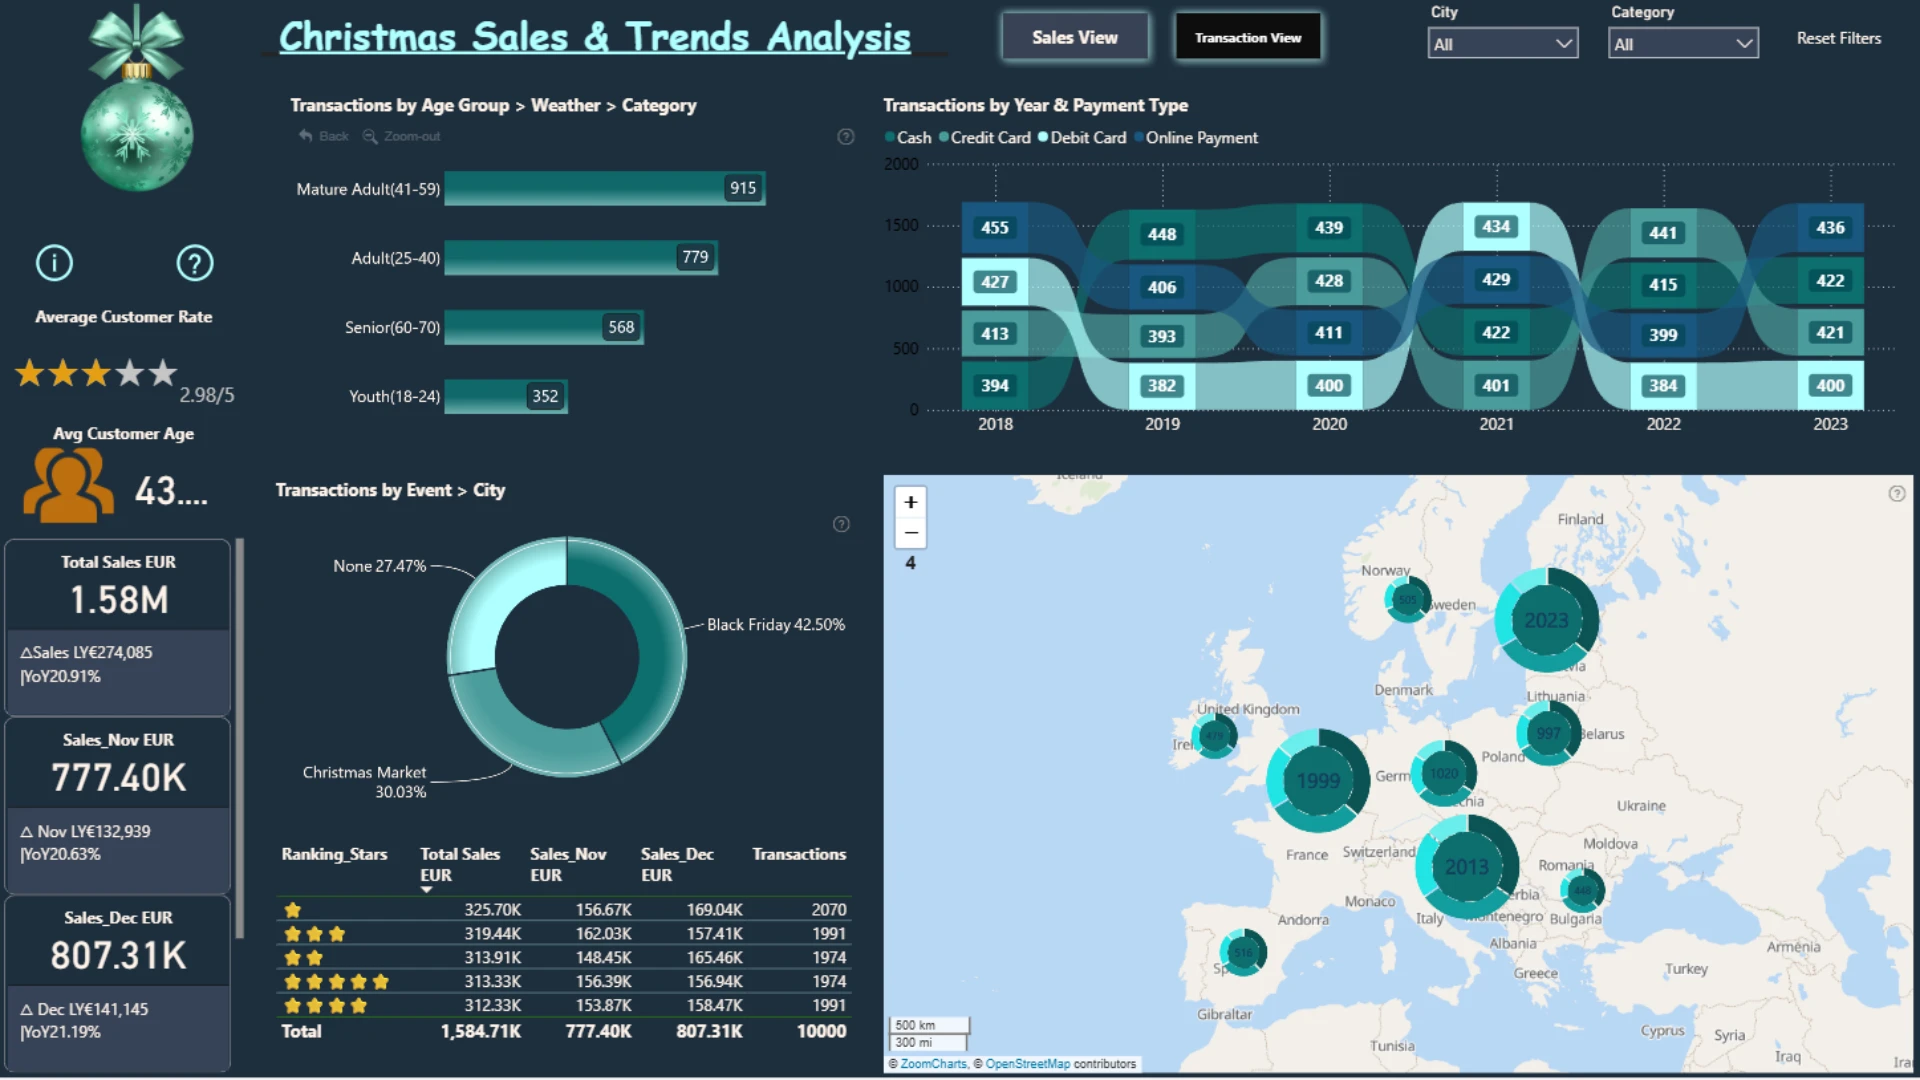
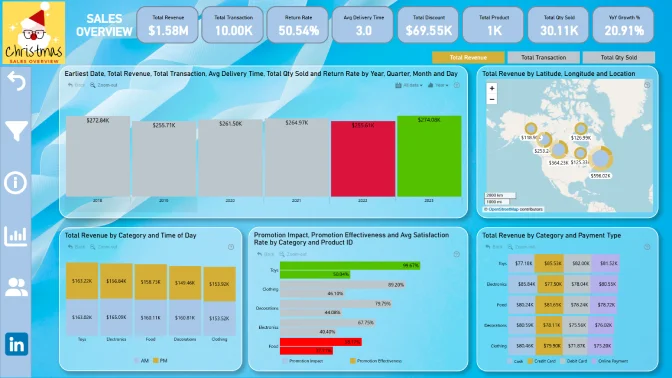
Hello! I'm excited to present my Christmas Challenge with Onyx Data. It was an engaging dataset covering Christmas sales over six years in November and December across 20 European cities, with total sales reaching 1.58 million euros and 10,000 transactions. This dataset has provided me with the opportunity to dive into the data and make some insights. Here are some key findings:
1.Online sales have significant growth, reaching 79.77% in 2023.
2.Parents' concern for buying gifts for their children is evident, making the Toys category the most popular in November and December over the years.
3.Customers love big sales, which is why Black Friday is the most popular event, accounting for 42.50% of all other events.
4.Fridays and Sundays are the most favored days for shopping.
5.Online payment has become the preferred payment method over the last year.
Thank you for the opportunity to participate in this challenge.
ZoomCharts visuals used
4U Report Challenges
Participate in data challenges, build and submit reports to get free template downloads.
Join CommunityMobile view allows you to interact with the report. To Download the template please switch to desktop view.
Was this helpful? Thank you for your feedback!
Sorry about that.
How can we improve it?