642
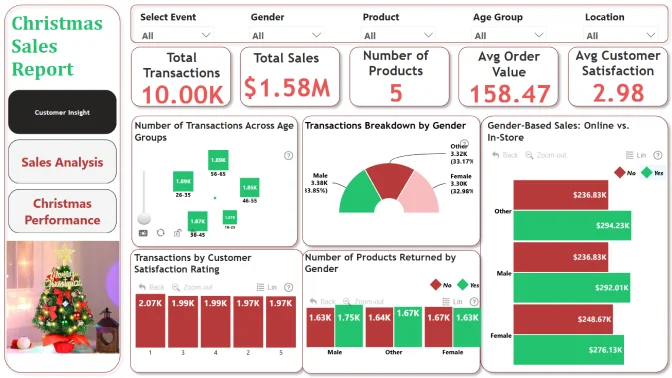
Christmas Sales Report 7
Christmas Sales Report 7
More Report pages
Report Author: Md Mizanur Rahman Nayan
642
Share template with others
Report submitted for the FP20 Analytics ZoomCharts Challenge, December 2024. The report was built using the Christmas Sales & Trends Dataset and includes ZoomCharts custom Drill Down PRO visuals for Power BI.
Author's description:
Objectives:
The primary goal of this analysis is to examine holiday shopping behavior and sales trends across Christmas, Black Friday, and non-event periods. Insights into customer preferences, the effectiveness of promotions, and factors driving customer satisfaction will inform strategies for optimizing future holiday sales.
Business Context:
Understanding consumer behavior during peak shopping events is crucial for businesses aiming to maximize revenue and improve customer satisfaction. Analyzing the data enables organizations to:
-
Tailor promotional campaigns to boost sales.
-
Identify factors influencing customer satisfaction.
-
Optimize inventory and staffing during high-demand periods.
-
Develop actionable strategies for future holiday seasons.
Data Overview:
Source: FP20 Analytics December 2024 Challenge
Key Variables:
-
Sales Metrics: Orders, order percentages, sales comparisons (CY vs. PY), and product categories.
-
Return Analysis: Return percentages and successful deliveries.
-
Geographical Insights: Sales distribution across regions.
Data Preparation and Modeling:
The data underwent cleaning, transformation, and modeling to ensure accuracy:
-
Cleaning: Corrected errors (e.g., swapped latitude/longitude), removed redundant columns, and standardized data types.
-
Modeling: Created a Date Table, custom columns, and established relationships between datasets for seamless visualization.
Key Insights:
-
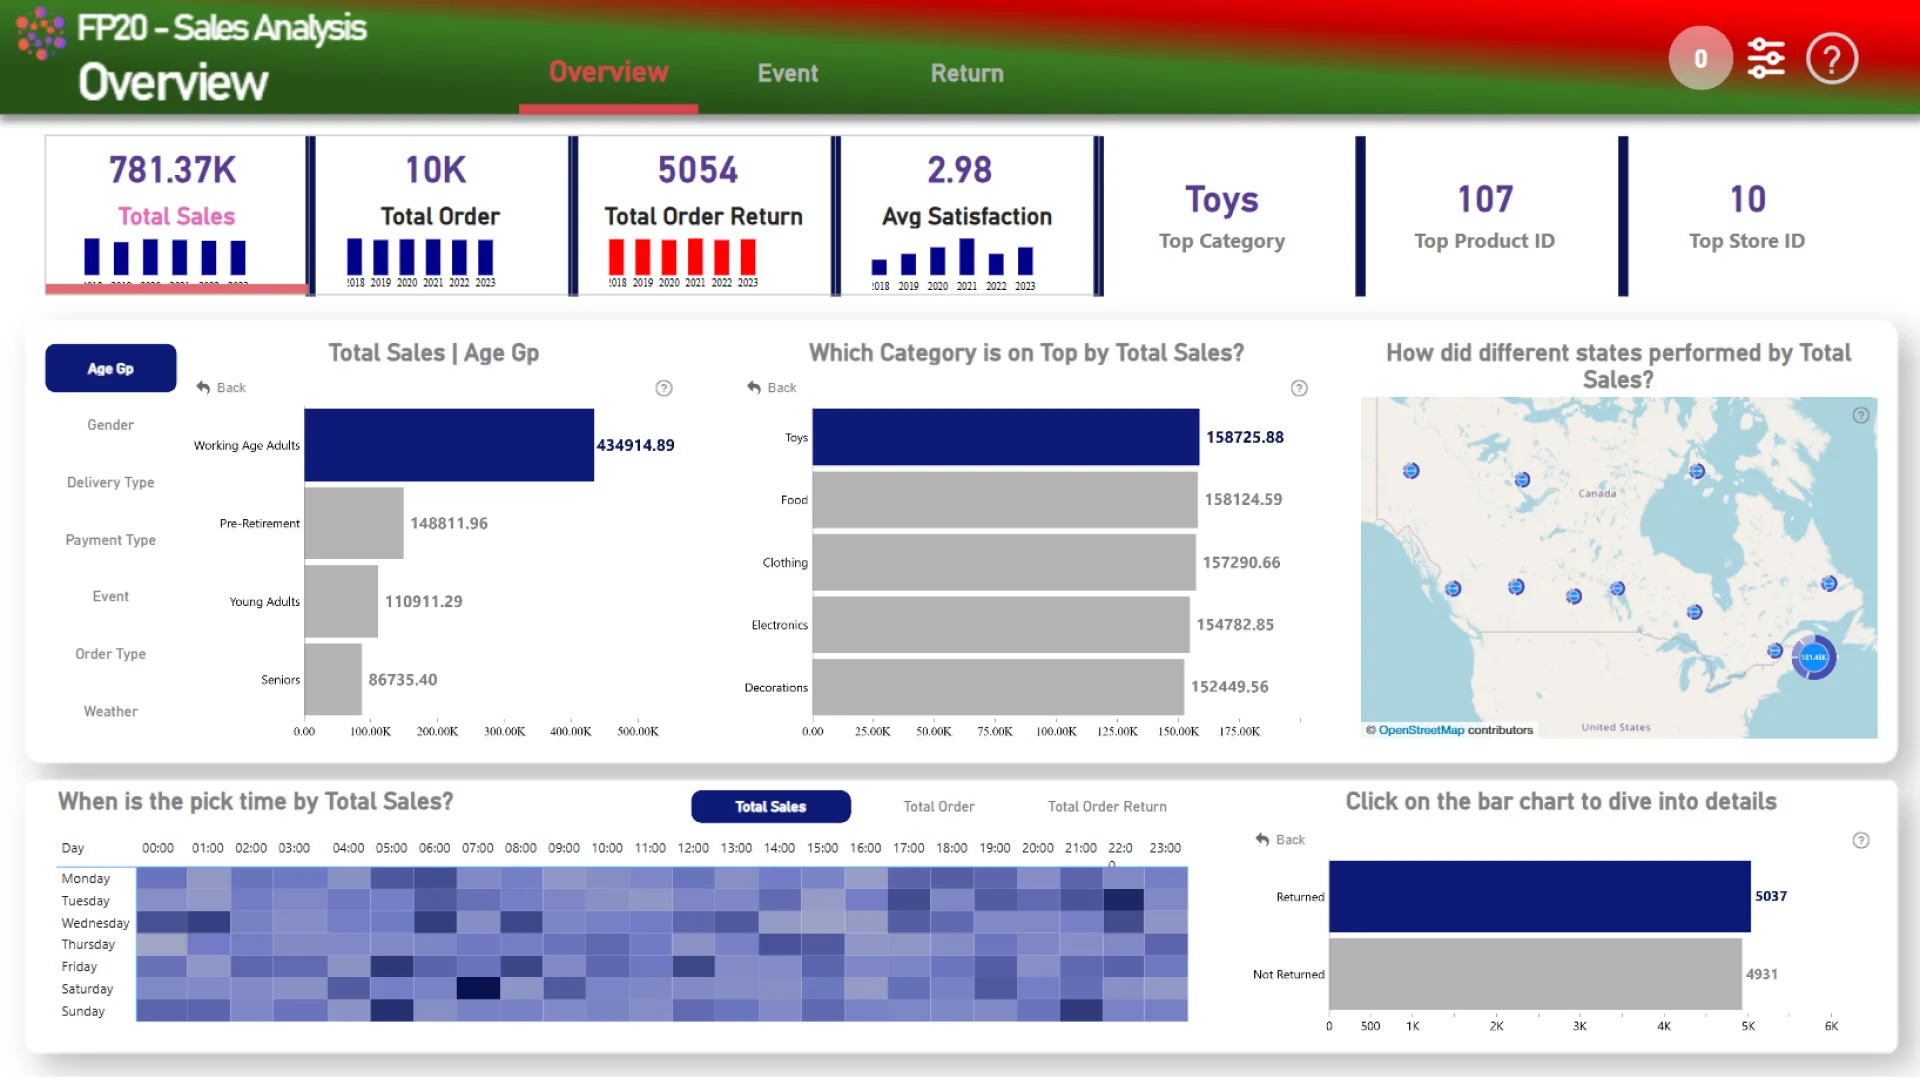
Overview:
-
50%+ of orders were returned.
-
Total sales: $781K, with Toys as the top revenue category, and Electronics leading in orders.
-
Most preferred delivery type: Priority Delivery.
-
Highest sales on Black Friday, with online orders dominating.
-
Evening hours (8 PM-10 PM) saw peak sales and return activity.
-
-
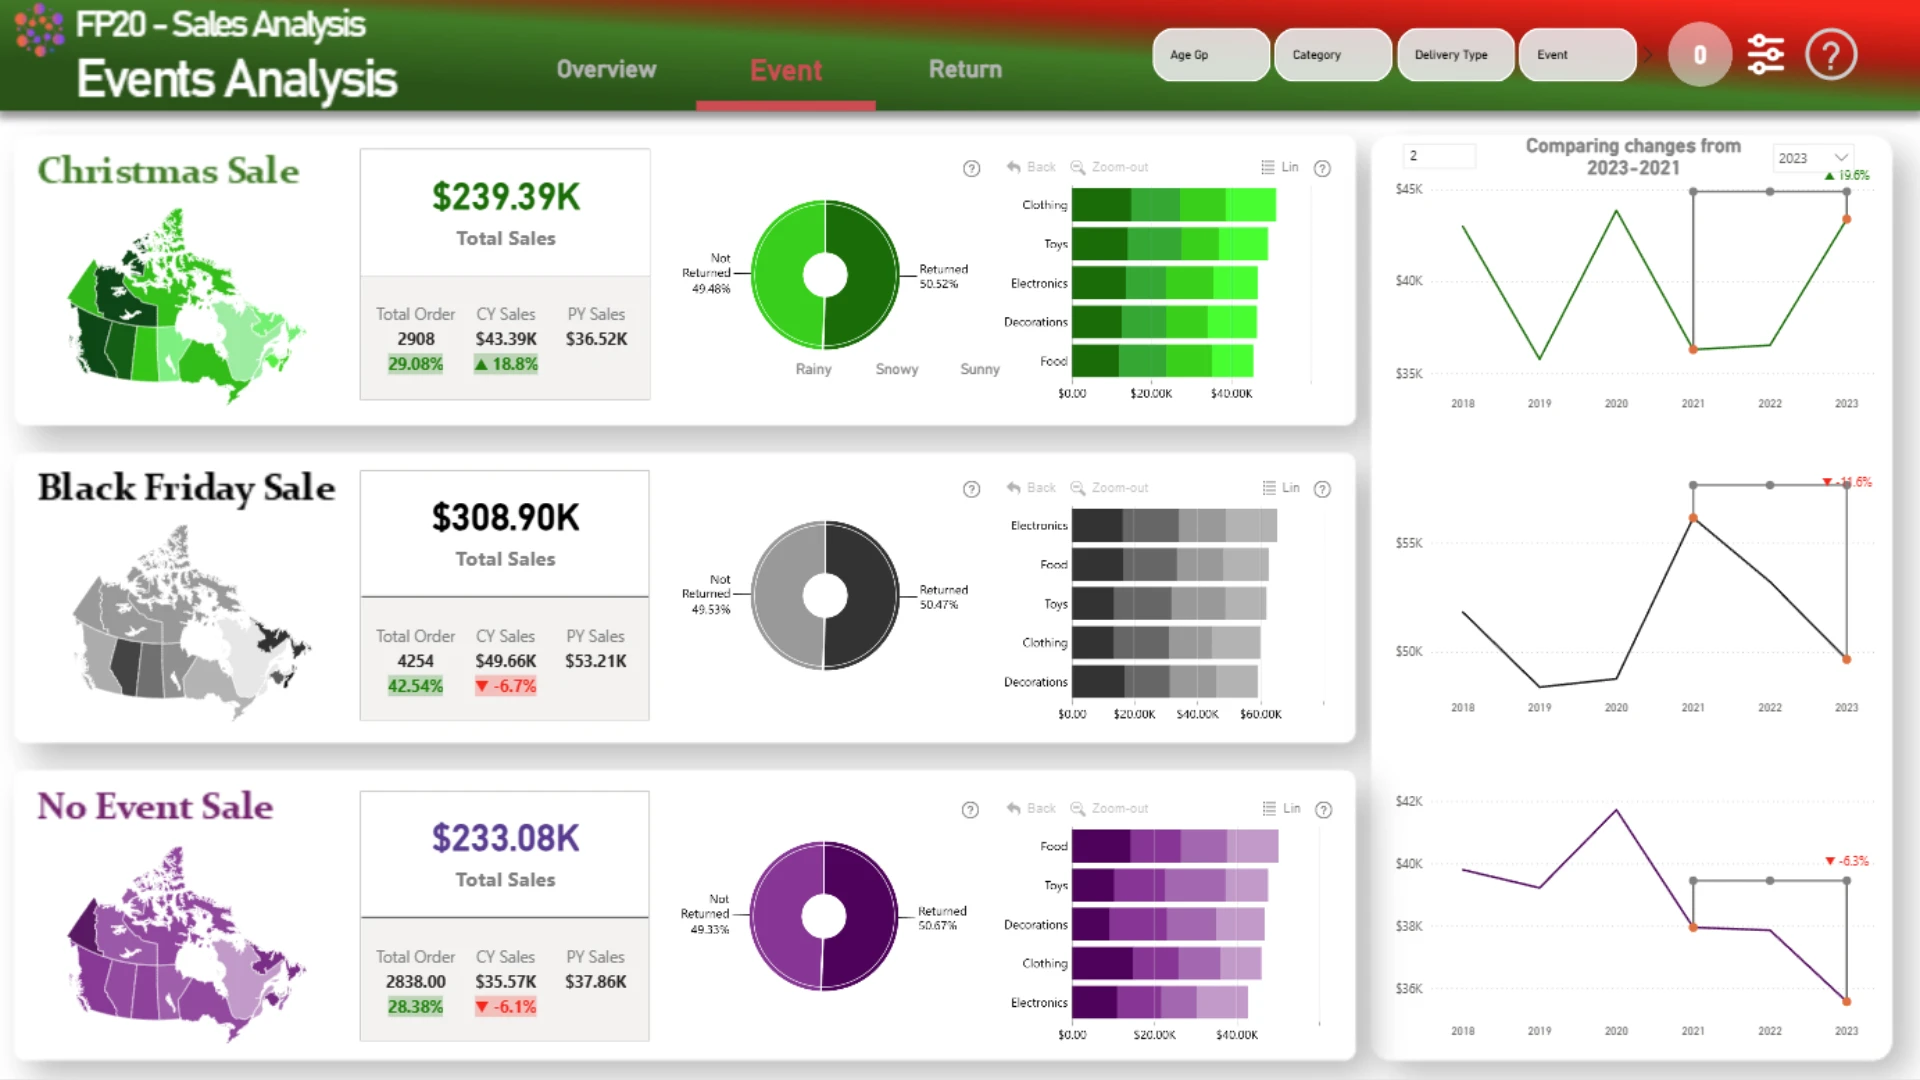
Event Analysis:
-
Christmas Market: $239.39K in sales, with an 18.8% YoY growth. Rainy weather drove the highest sales, and Clothing was the most popular category.
-
Black Friday: $308.90K in sales, but a 6.7% YoY decline. Electronics topped the sales charts.
-
Non-Event Periods: $233.08K in sales, with a 6.3% YoY decline. Food was the preferred category during these times.
-
-
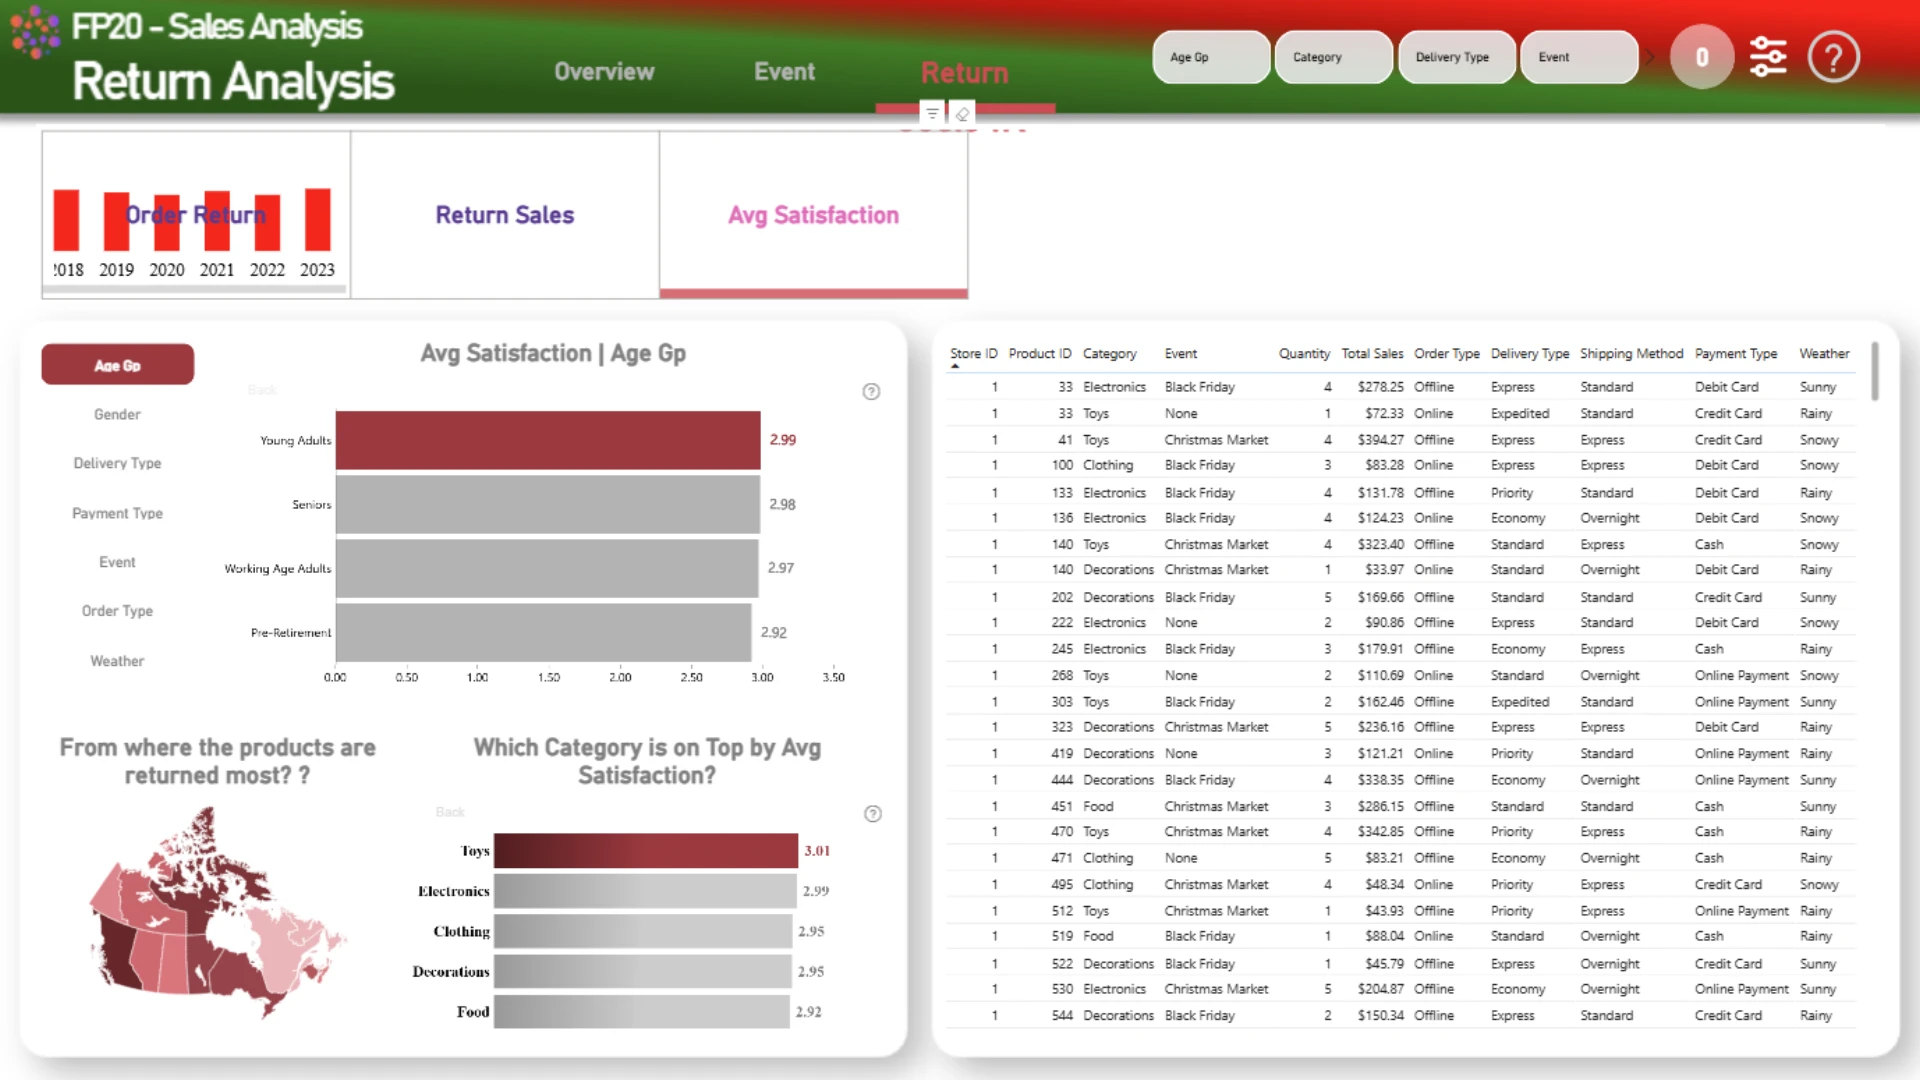
Return Analysis:
-
Total returns: $803K, exceeding total sales, indicating significant issues with satisfaction or purchase behavior.
-
Returns were highest among Working Age Adults, particularly for Electronics, with online payments and express delivery linked to higher return rates.
-
Findings:
-
Sales vs. Returns Timing Correlation: Peak sales coincide with peak return times, suggesting dissatisfaction or impulse buying.
-
Event-Specific Trends: Black Friday had the highest returns, particularly for Electronics, indicating a need to improve product descriptions or manage customer expectations.
-
Weather Impact: Rainy weather boosted sales during the Christmas Market but also contributed to higher return rates, likely due to rushed purchases.
-
Demographics: Working Age Adults are key, contributing significantly to both sales and returns.
Recommendations:
-
Improve Product Descriptions for Electronics: Address high return rates by ensuring clearer product descriptions and quality assurance processes.
-
Target Peak Hours for Promotions: Focus campaigns on Fridays and Saturdays during peak sales hours (12 PM–6 PM) while addressing dissatisfaction during evening purchases (8 PM–10 PM).
-
Region-Specific Strategies: Develop plans for areas with high return rates (e.g., British Columbia) and capitalize on strong regions (e.g., Newfoundland and Labrador).
-
Enhance Customer Satisfaction for Working Adults: Tailor loyalty programs or post-purchase engagement strategies to this demographic.
-
Reassess Express Delivery: Ensure the Express Delivery offering meets customer expectations to reduce return rates associated with expedited services.
4U Report Challenges
Participate in data challenges, build and submit reports to get free template downloads.
Join CommunityMobile view allows you to interact with the report. To Download the template please switch to desktop view.

Was this helpful? Thank you for your feedback!
Sorry about that.
How can we improve it?