logo
For Power BI
  • Products
    • Custom Visuals for Power BI
    • Report Templates
  • Resources

      Resources

    • Documentation
    • Report Examples
    • Blog
    • Webinars
    • Video Tutorials
    • Visuals Gallery

    Support

    • ZoomCharts Assistance
    • Contact Sales
    • Contact Support
    • FAQ

    Challenges

    Challenges

    Improve your report creation skills by participating in free challenges for report creators.

    Learn more
    Get Developer License
  • Services
    • Power BI Report Development
    • Custom Visual Development
  • Challenges
  • Pricing
    • Custom Visuals for Power BI
    • Report Templates
Subscribe
Subscribe
Get it now
Go back

Contents

Contest logo
Contest logo
Contest logo
Contest logo
Try Free Now
Go back

Onyx Data December 2023 Challenge

Report Author: Harshit Raj

194

Christmas Sales report 11

Report
Report Interact

Combo Bar Timeline Waterfall Donut Christmas Sales

Share template with others

Report submitted for Onyx Data DataDNA ZoomCharts Mini Challenge, December 2023. The report was built based on Christmas Sales and Trends dataset and includes ZoomCharts custom Drill Down PRO visuals for Power BI. 

Author's description:
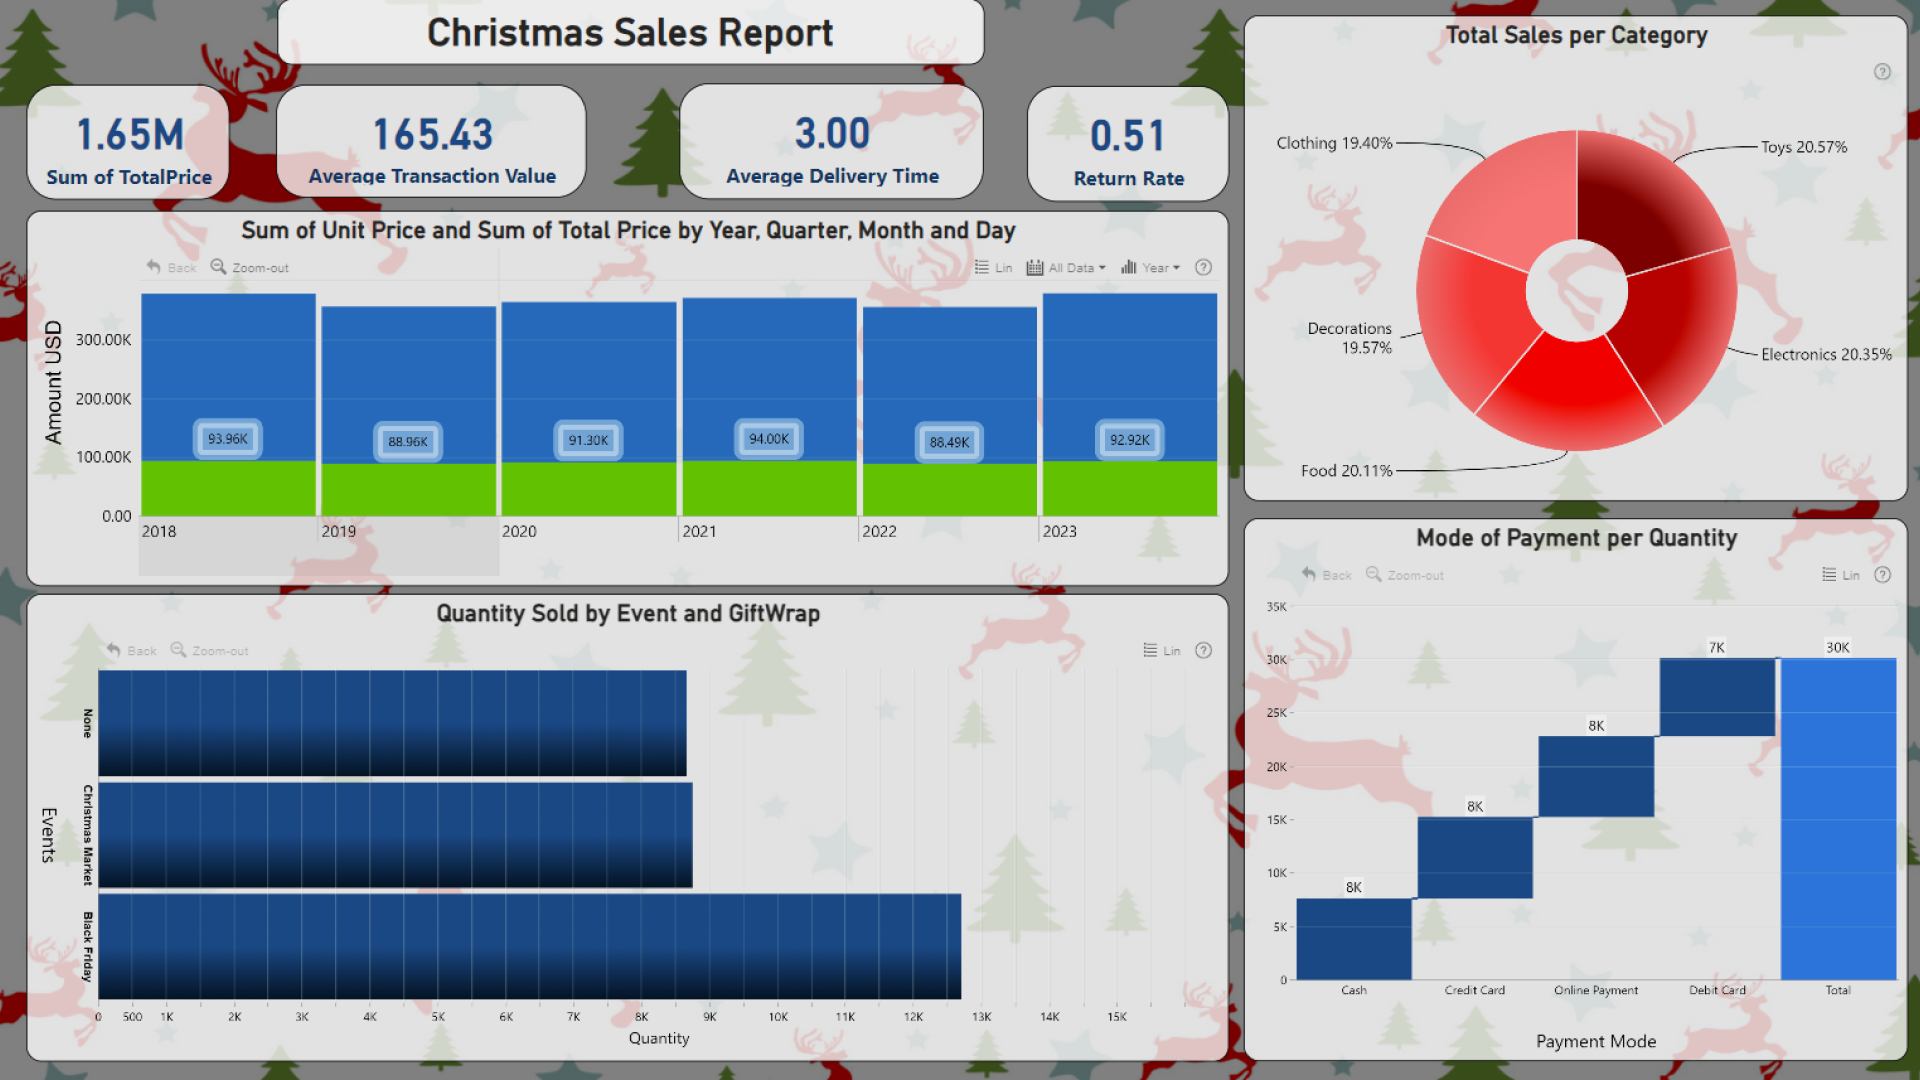
This dashboard provides a comprehensive overview of sales performance during the Christmas season, analyzing key metrics such as sales trends over years, months, and days, category-wise sales distribution, sales quantity during events with and without gift wrapping, payment methods, and essential transaction statistics.
Combo Bar Chart - Unit Sold Over Years, Months, Days: Visualization: Combo bar chart displaying the total units sold over the years, broken down by months and days. Insights: Visualizes the trend of units sold during Christmas seasons across multiple years, months within the Christmas period, and specific days showing peak sales.
Pie Chart - Total Sales per Category: Visualization: Pie chart illustrating the distribution of total sales across different product categories. Insights: Offers an overview of which product categories contribute the most to overall sales during the Christmas season.
Bar Chart - Quantity Sold by Event and Gift Wrap: Visualization: Bar chart showcasing the quantity of products sold during specific events (e.g., Christmas, Black Friday) based on whether gift wrapping was applied or not. Insights: Highlights the impact of events and gift wrapping on the quantity of items sold, providing insights into customer preferences during these events.
Waterfall Chart - Mode of Payment (Cash, Credit Card, Online Payment): Visualization: Waterfall chart presenting the mode of payment breakdown (Cash, Credit Card, Online Payment) and their contribution to total sales. Insights: Offers a visual representation of how different payment methods contribute to sales, showcasing the dominant mode of payment during the Christmas period.
Cards - Key Performance Indicators: Total Price: Displays the total revenue generated during the Christmas sales period.
Average Transaction Value: Exhibits the average value of each transaction during the Christmas season.
Average Delivery Time: Represents the average number of days taken for delivery during Christmas sales.
Return Rate: Highlights the percentage of returned items in relation to total transactions during the Christmas season.
Summary: This dashboard allows stakeholders to understand the sales performance during the Christmas period, providing insights into sales trends, product categories driving revenue, the impact of events and gift wrapping on sales quantity, preferred payment methods, and key performance indicators shaping the overall sales experience. These visualizations assist in making informed decisions and developing strategies to optimize sales during festive seasons like Christmas.

ZoomCharts visuals used

Drill Down Waterfall PRO Drill Down Waterfall PRO
Drill Down Combo Bar PRO Drill Down Combo Bar PRO
Drill Down Timeline PRO Drill Down Timeline PRO
Drill Down Donut PRO Drill Down Donut PRO

Need help?

Send your question to ZoomCharts assistant, and we will respond to you as soon as possible.

Contact Us

Mobile view allows you to interact with the report. To Download the template please switch to desktop view.

Report Overhaul

ZoomCharts Academy

Learn ZoomCharts with experts and become certified!

Go to Academy!
Report Overhaul

Was this helpful? Thank you for your feedback!

Sorry about that.

How can we improve it?

Christmas Sales report 11

Share

ZoomCharts

Welcome to ZoomCharts

You’re almost there! Create an account to keep your saved reports.

or
Sign up with Microsoft

Verify your email address

We have sent a code to your email address. Please input the code below.

Didn't receive code? Request again (after 30 seconds)

Already have an account? Log in

ZoomCharts

Log in to your ZoomCharts account

Log in with Microsoft
or
Forgot password?

Reset your password

We'll email you instructions on how to reset your password

Don't have an account? Sign up

Please add credits

You have 0 available downloads.
Get more credits or upgrade your plan to continue.

View pricing
logo
[email protected]
+44 204 577 3993
logo

Products

Drill Down Network PRO Drill Down Waterfall PRO Drill Down Graph PRO Drill Down Combo PRO Drill Down Combo Bar PRO Drill Down Donut PRO Drill Down Pie PRO Drill Down TimeSeries PRO Drill Down Timeline PRO Drill Down Map PRO Drill Down Scatter PRO All Visuals

Resources

Report Examples Webinars Blog ZoomCharts Academy Visuals Gallery Documentation Custom Visual Development Subscribe to News

Solutions

Custom Visual Development

Company

Pricing About Us Partners Leave feedback Join PowerGroup EU Funding

Help

ZoomCharts Assistance Contact Sales Contact Support FAQ

Drill Down Network PRO Drill Down Waterfall PRO Drill Down Graph PRO Drill Down Combo PRO Drill Down Combo Bar PRO Drill Down Donut PRO Drill Down Pie PRO Drill Down TimeSeries PRO Drill Down Timeline PRO Drill Down Map PRO Drill Down Scatter PRO All Visuals

Report Examples Webinars Blog ZoomCharts Academy Visuals Gallery Documentation Custom Visual Development Subscribe to News

Custom Visual Development

Pricing About Us Partners Leave feedback Join PowerGroup EU Funding

ZoomCharts Assistance Contact Sales Contact Support FAQ
+44 204 577 3993
[email protected]

Ready to get in touch?

Contact our experts with any question about Power BI and ZoomCharts for Free!

Contact us

© 2025, Data Visualization Software Lab

U.S. Patents No. 11,645,343; 11,921,804; 12,346,389

Cookies
Privacy Policy
Global
Legal
Patent
warning

Error message

success

Success info: Done!

ZoomCharts AI Assistant

We noticed you're using an old OS version.

For the best experience, we recommend upgrading to ensure that all website features display correctly.

Cookie settings

We use necessary cookies for site functionality, as well as statistic, marketing, and preference cookies to enhance your experience. For more information and to manage your preferences, please visit our Cookie policy