662
Chrismas Sales Trends Analysis
Chrismas Sales Trends Analysis
More Report pages
Report Author: Miguel Lozano
662
Share template with others
Report submitted for the FP20 Analytics ZoomCharts Challenge, December 2024. The report was built using the Christmas Sales & Trends Dataset and includes ZoomCharts custom Drill Down PRO visuals for Power BI.
Author's description:
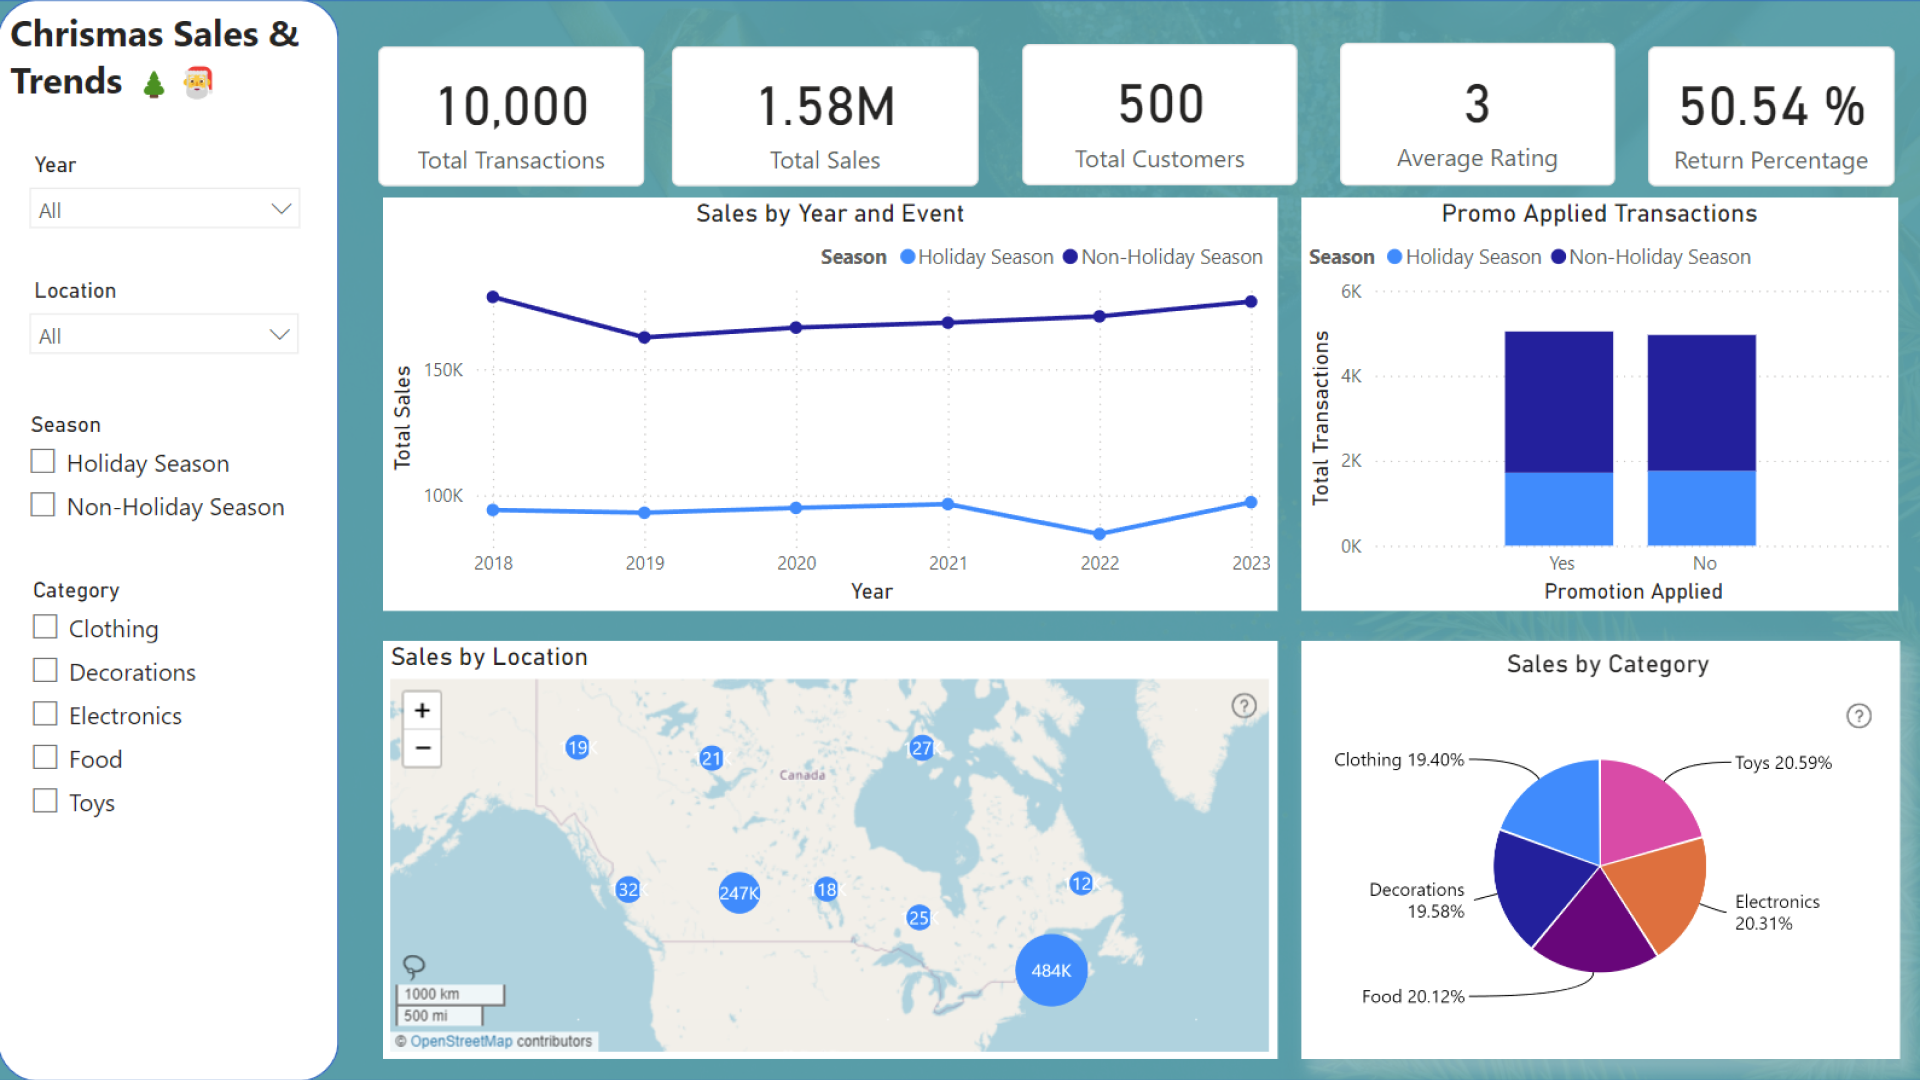
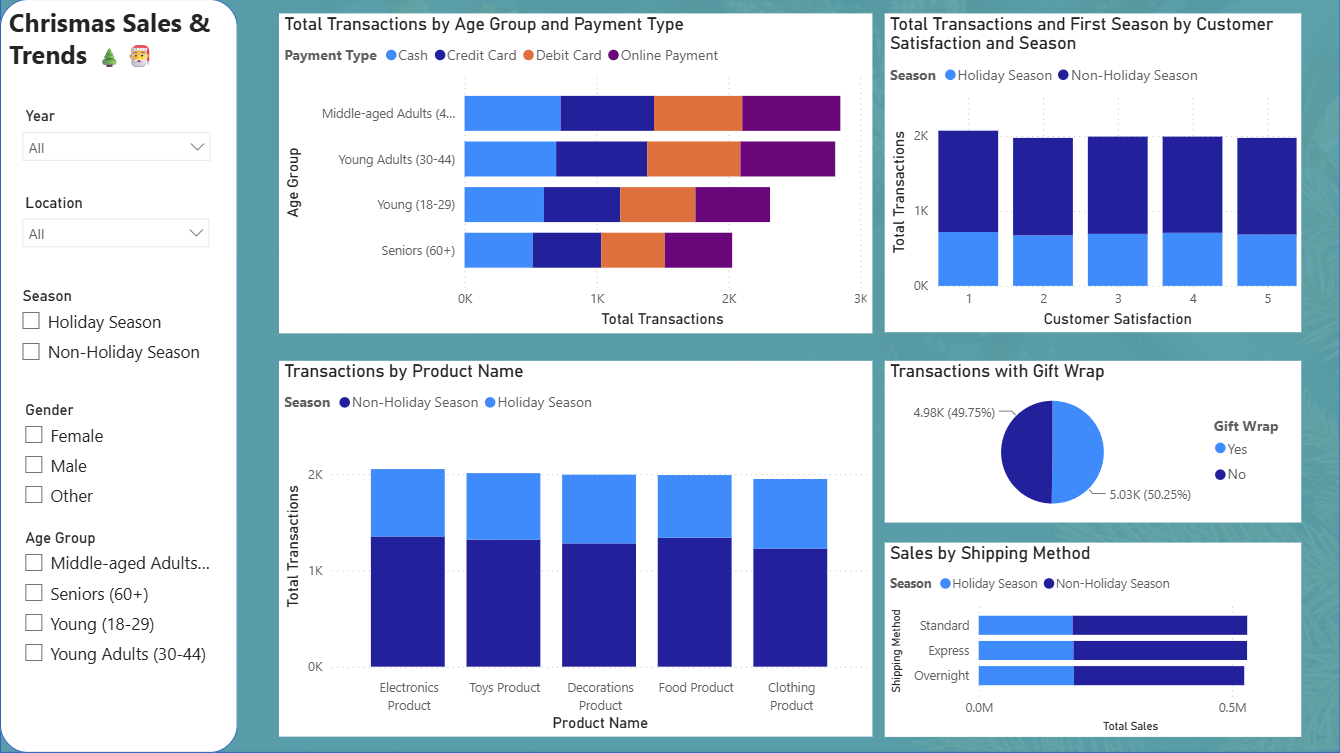
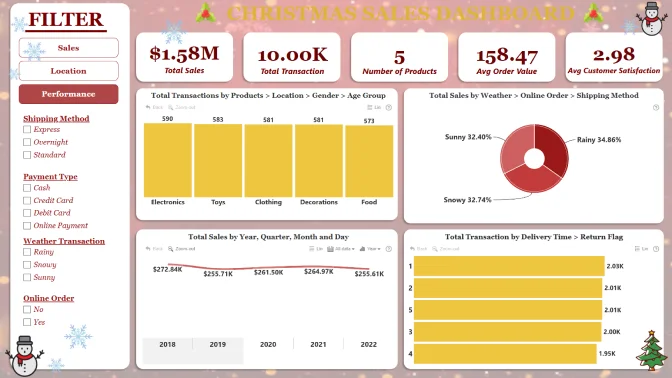
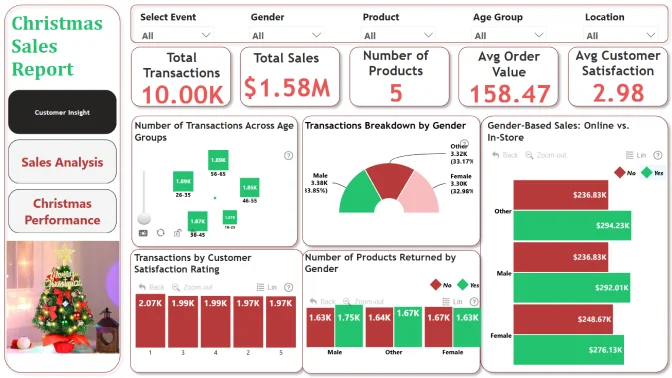
This project focuses on analyzing sales data during the Christmas season using Power BI. It highlights key metrics like total sales, return rates, and customer satisfaction. The analysis reveals trends in regions, product categories, and customer behavior, providing actionable insights to optimize inventory, improve satisfaction, and target demographics effectively during the holiday season.
4U Report Challenges
Participate in data challenges, build and submit reports to get free template downloads.
Join CommunityMobile view allows you to interact with the report. To Download the template please switch to desktop view.

Was this helpful? Thank you for your feedback!
Sorry about that.
How can we improve it?