844
Campaign Digital Media Performance Overview
Campaign Digital Media Performance Overview
Report Author: Mrinalini Mehta
844
Share template with others
Report submitted for OnyxData #DataDNA and ZoomCharts Challenge June 2024. The report was built with the Marketing Campaing Dataset and includes ZoomCharts custom Drill Down PRO visuals for Power BI.
Author's description:
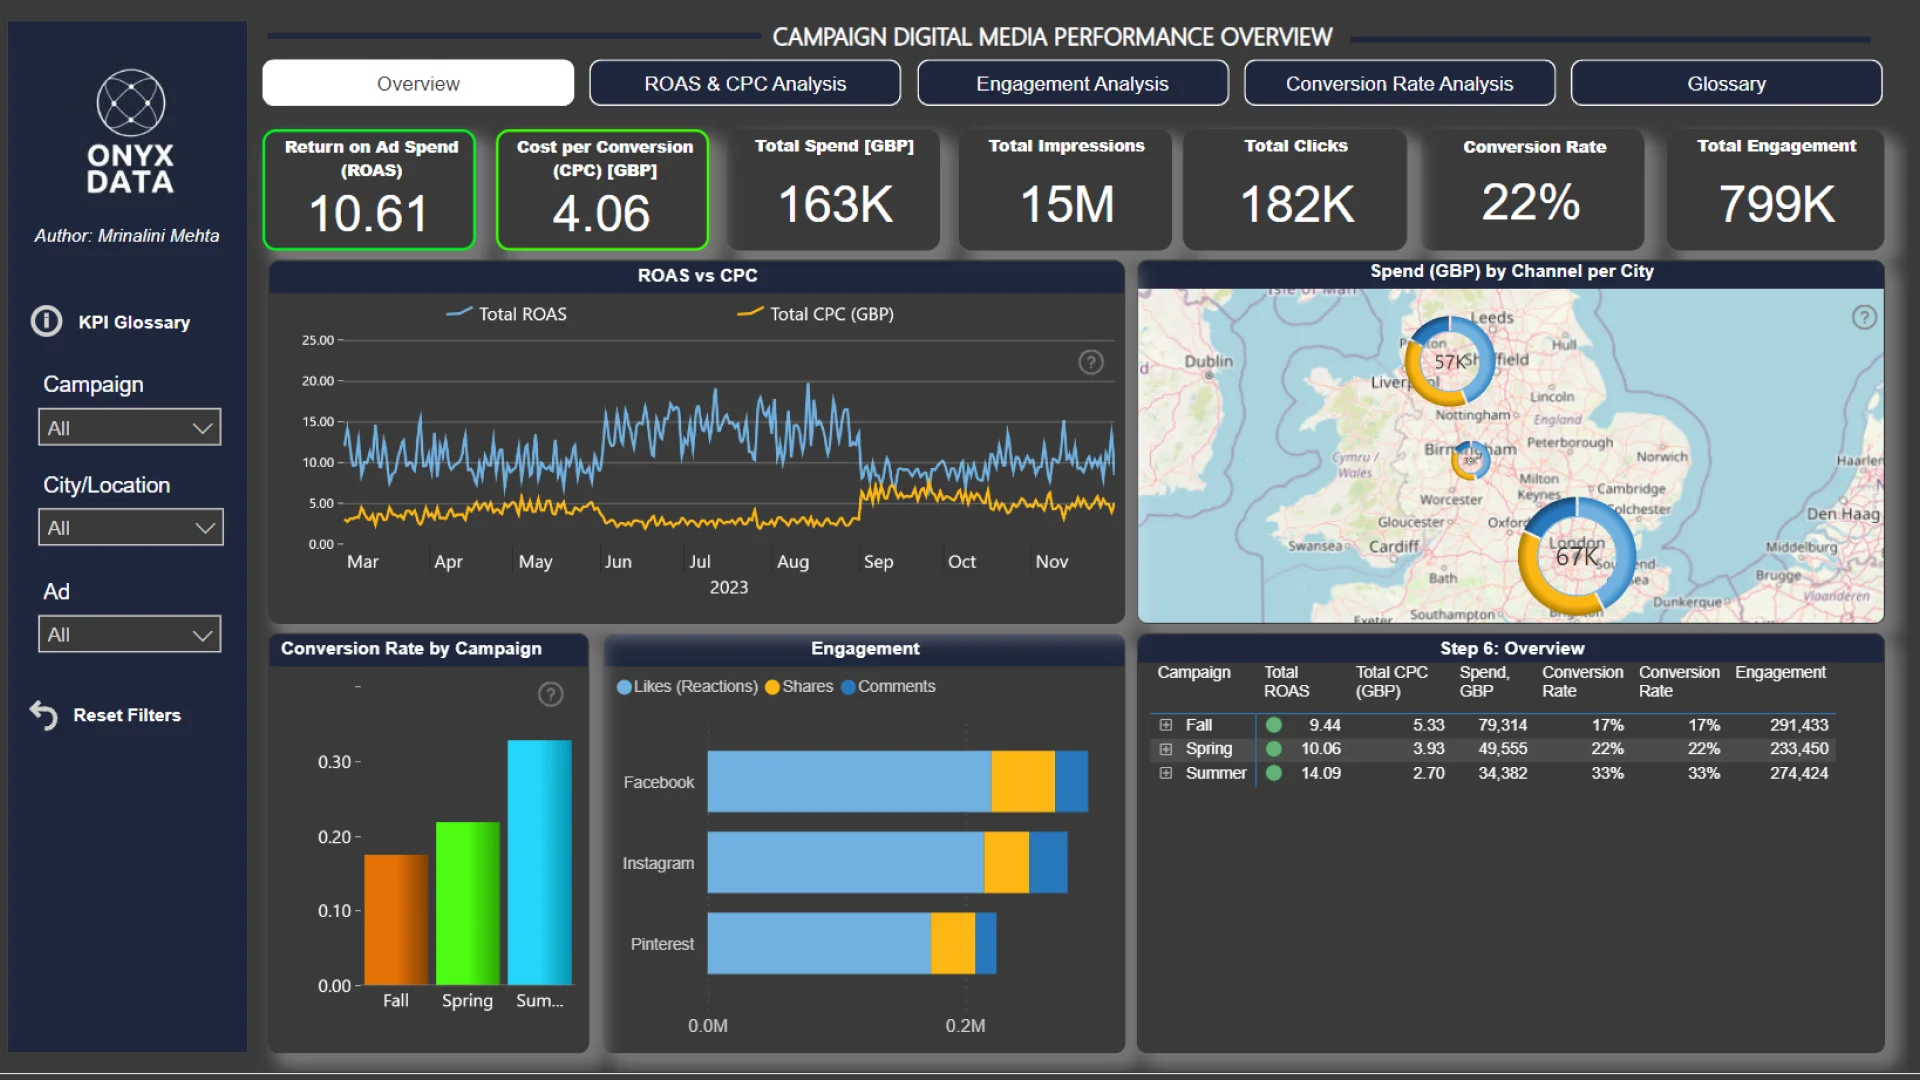
The top KPI cards show that average ROAS and average CPC are higher than the average industrial standard (for the fashion industry in the UK) of 5 and 4 GBP, respectively. As can be seen, the Summer Campaign was the most successful in terms of ROAS vs. CPC. The high ROAS vs. CPC in summer indicates a seasonal advantage. It is advisable for the business to optimize marketing spend during summer for maximum returns and develop strategies to enhance performance during other seasons to ensure year-round growth. The transition from summer to fall sees a very close CPC and ROAS, which should be investigated.
Analyzing city-wise performance reveals that Birmingham boasts the highest conversion rate (29%), highest ROAS (13.93), and lowest CPC (3.09 GBP), despite having the lowest number of impressions (4M) and total spend (39K GBP) compared to London and Manchester. This suggests that Birmingham residents are more fashion-savvy, warranting increased investment in this market. Conversely, it is crucial to investigate why the substantial investment in London (67K GBP) and the highest impressions (6M) have resulted in the poorest performance.
Analyzing ROAS for the entire period, Discount Ads deliver the best performance (11.97), followed by Collection Ads (9.11), with Summer campaigns leading overall. Notably, Collection Ads in Fall perform best in Manchester (ROAS of 10). Pinterest is the most favored channel across all ads and campaigns, except for Collection Ads during Summer, where Instagram (ROAS of 16.65) leads in Manchester. In Summer, Birmingham users prefer Desktop for Discount Ads across all channels, while Manchester and London users favor Mobile. During Spring and Fall, Desktop is the preferred device across all cities and channels.
Conclusions and Recommendations:
- Focus on Discount Ads: Given their high ROAS, prioritize Discount Ads, especially in summer.
- Leverage Instagram in Manchester: Utilize Instagram for Collection Ads during summer for optimal returns.
- Optimize Device Targeting: Tailor ad delivery to Desktop users in Birmingham for summer campaigns, and ensure mobile optimization for Manchester and London.
- Enhance Multi-Season Strategies: Adapt strategies for seasonal preferences, focusing on Desktop users in Spring and Fall.
Engagement Analysis:
Facebook demonstrates the highest engagement during Fall (106K) and Spring (92K), consistently leading across all three channels. In Summer, Instagram surpasses Facebook with 97K engagements. Notably, Pinterest excels in conversion rates, despite having the lowest investment (28K), whereas Facebook commands the highest investment (72K) across all seasons.
Conclusions and Recommendations:
- Optimize Investment Allocation: Given Pinterest's superior conversion rates with lower investment, consider reallocating a portion of the budget from Facebook to Pinterest to enhance overall ROAS.
- Seasonal Strategy Adjustment: Maintain strong engagement efforts on Facebook during Fall and Spring, while boosting Instagram campaigns in Summer to capitalize on seasonal user behavior.
- Cross-Channel Synergy: Leverage the high engagement on Facebook to drive traffic to conversion-optimized Pinterest campaigns, creating a synergistic effect across channels.
Pinterest has a commanding lead across all campaigns, all cities, and both ads when it comes to CPC and ROAS.
Final Verdict:
Leveraging these insights, businesses should prioritize Summer campaigns on Instagram in Manchester, and tailor desktop-focused strategies for Birmingham. Additionally, reallocating resources to optimize Pinterest campaigns could enhance overall performance, ensuring targeted engagement and maximizing ROI across different platforms and seasons. This strategic approach will capitalize on regional preferences and device usage, driving sustainable growth in the fashion industry.
ZoomCharts visuals used
4U Report Challenges
Participate in data challenges, build and submit reports to get free template downloads.
Join CommunityMobile view allows you to interact with the report. To Download the template please switch to desktop view.
Was this helpful? Thank you for your feedback!
Sorry about that.
How can we improve it?