1392
Athlete Health & Injury Report
Athlete Health & Injury Report
Report Author: PEISHENG Qian
1392
Share template with others
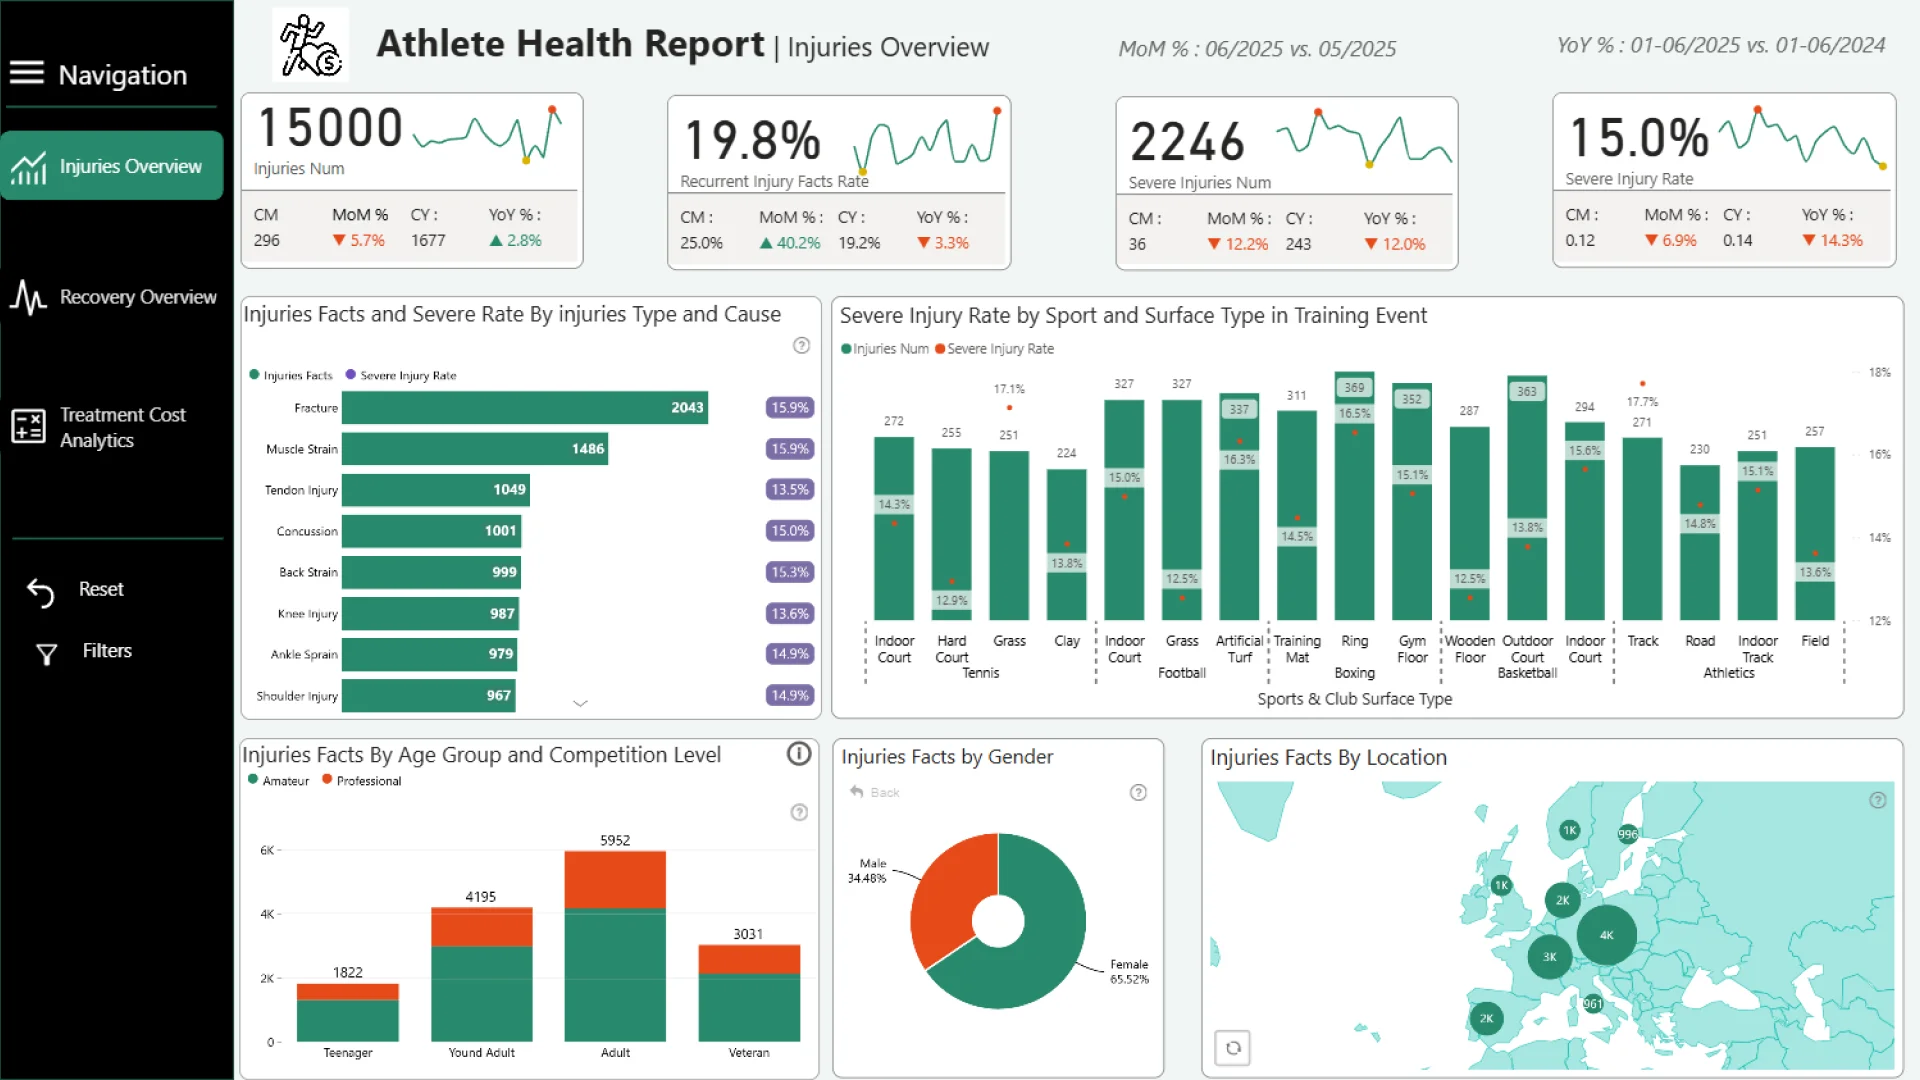
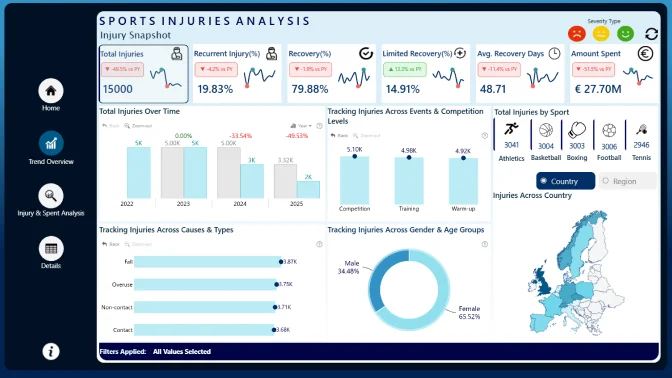
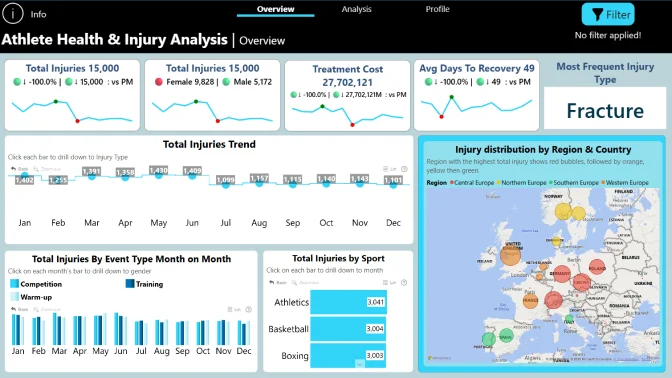
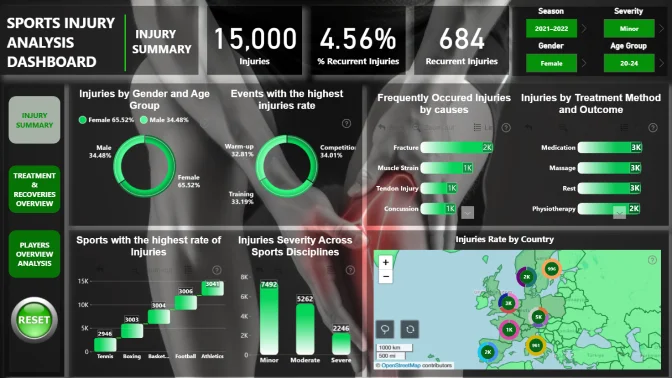
This Power BI report uses the Athlete Health and Injury dataset and features ZoomCharts Drill Down PRO custom visuals for Power BI. It was submitted to the FP20 Analytics ZoomCharts Data Challenge in August 2025.
Author's Description:
The report is split into three main sections: "Injuries Overview", "Recovery Overview", and "Treatment Cost Analytics" to allow for a deep-dive analysis of the data. 1. Injuries Overview This high-level dashboard provides KPIs for overall injuries, severe injuries, and injury rates, with trend analysis and detailed breakdowns by sport and training surface to help identify key influences on injury outcomes. 2. Recovery Overview Focused on athlete recovery and return-to-play status, this section tracks key metrics like Average Days of Treatment and Fully Recovered Rate. The page features an interactive component that uses historical data to highlight the "Highest Recovered Rate Method" and "Shortest Recovered Method," providing a data-backed reference for treatment decisions. 3. Treatment Cost Analytics This section analyzes the financial impact of injuries. It includes visuals that break down treatment costs by method, severity, and sport type, allowing for a deep dive into the financial distribution of different sports and events.
ZoomCharts visuals used
4U Report Challenges
Participate in data challenges, build and submit reports to get free template downloads.
Join CommunityMobile view allows you to interact with the report. To Download the template please switch to desktop view.
Was this helpful? Thank you for your feedback!
Sorry about that.
How can we improve it?