logo
For Power BI
  • Products
    • Custom Visuals for Power BI
    • Report Templates
  • Resources

      Resources

    • Documentation
    • Report Examples
    • Blog
    • Webinars
    • Video Tutorials
    • Visuals Gallery

    Support

    • ZoomCharts Assistance
    • Contact Sales
    • Contact Support
    • FAQ

    Challenges

    Challenges

    Improve your report creation skills by participating in free challenges for report creators.

    Learn more
    Get Developer License
  • Services
    • Power BI Report Development
    • Custom Visual Development
  • Challenges
  • Pricing
    • Custom Visuals for Power BI
    • Report Templates
Subscribe
Subscribe
Get it now
Go back

Contents

Contest logo
Contest logo
Contest logo
Contest logo
Try Free Now
Go back

FP20 Analytics January 2024 Challenge

Report Author: Norman Reynaldo Sabillon Castro

781

Analysis of the Evaluation Level

Report
Report Interact

Combo Combo Bar Donut Education

Share template with others

Report submitted for FP20 Analytics ZoomCharts Challenge 13 (Jan 17 – Feb 15, 2024). The report was built with Education Management dataset and includes ZoomCharts custom Drill Down PRO visuals for Power BI. 

Author's description:
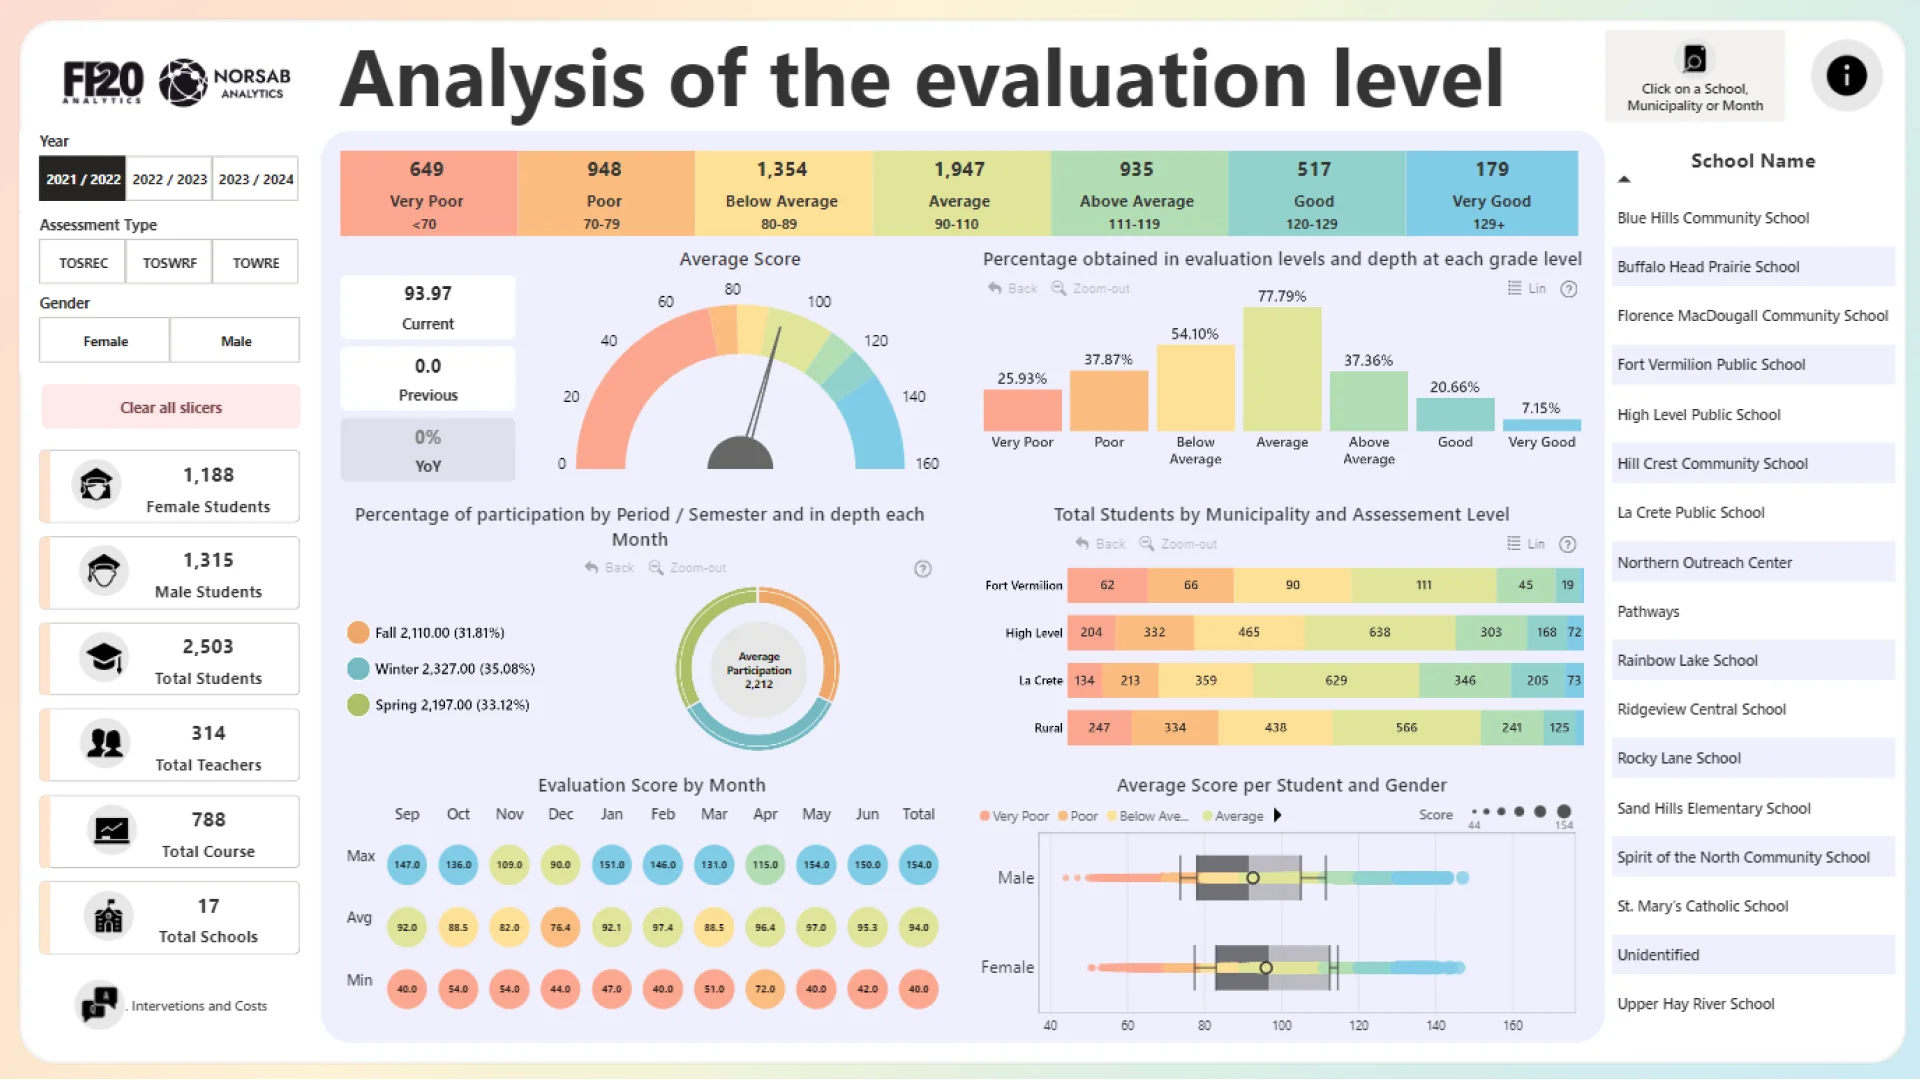
I created this report titled "Analysis of the Evaluation Level" with the aim of providing a comprehensive, single-page view that features interactive charts based on assessment levels.
The report includes three filters: Year, Assessment Type, and Gender, allowing for customized data exploration. It features a section of cards displaying totals such as female and male students, total students combined, number of teachers, total courses, and total schools.
Scores are categorized by assessment levels ranging from Very Poor (below 70) to Very Good (above 129), with a color scale applied across the report for visual differentiation. This color scale changes only in transparency to contrast between background and text, adhering to specific score ranges.
A key feature is the main chart showing the average score across the report, including current and previous values, as well as year-over-year percentage change.
There's also a bar chart for deep diving into assessment levels by grade, featuring a color gradient. A donut chart represents participation by period or semester (excluding summer), with drill-down capabilities into specific months, visually enhanced by seasonal color gradients. Additionally, the report offers a 100% stacked bar chart for student participation by municipality across different assessment levels, and a heatmap for monthly performance from September to June, representing the school year. Each value in the heatmap is encircled, differentiated by color according to its value.
There's also a box plot categorized by gender, with sizes based on scores, following the report's color palette, and a detailed tooltip including school, name, grade, and individual assessment scores plus the average. On the right side, a school list functions as a filter for analyzing specific schools, complemented by a drill-through button for detailed score data across various dimensions. This button activates with selections from schools, municipalities, or months from the mentioned charts, including an info button detailing the report's structure.

ZoomCharts visuals used

Drill Down Combo PRO Drill Down Combo PRO
Drill Down Combo Bar PRO Drill Down Combo Bar PRO
Drill Down Donut PRO Drill Down Donut PRO

Need help?

Send your question to ZoomCharts assistant, and we will respond to you as soon as possible.

Contact Us

Mobile view allows you to interact with the report. To Download the template please switch to desktop view.

Report Overhaul

ZoomCharts Academy

Learn ZoomCharts with experts and become certified!

Go to Academy!
Report Overhaul

Was this helpful? Thank you for your feedback!

Sorry about that.

How can we improve it?

Analysis of the Evaluation Level

Share

ZoomCharts

Welcome to ZoomCharts

You’re almost there! Create an account to keep your saved reports.

or
Sign up with Microsoft

Verify your email address

We have sent a code to your email address. Please input the code below.

Didn't receive code? Request again (after 30 seconds)

Already have an account? Log in

ZoomCharts

Log in to your ZoomCharts account

Log in with Microsoft
or
Forgot password?

Reset your password

We'll email you instructions on how to reset your password

Don't have an account? Sign up

Please add credits

You have 0 available downloads.
Get more credits or upgrade your plan to continue.

View pricing
logo
[email protected]
+44 204 577 3993
logo

Products

Drill Down Network PRO Drill Down Waterfall PRO Drill Down Graph PRO Drill Down Combo PRO Drill Down Combo Bar PRO Drill Down Donut PRO Drill Down Pie PRO Drill Down TimeSeries PRO Drill Down Timeline PRO Drill Down Map PRO Drill Down Scatter PRO All Visuals

Resources

Report Examples Webinars Blog ZoomCharts Academy Visuals Gallery Documentation Custom Visual Development Subscribe to News

Solutions

Custom Visual Development

Company

Pricing About Us Partners Leave feedback Join PowerGroup EU Funding

Help

ZoomCharts Assistance Contact Sales Contact Support FAQ

Drill Down Network PRO Drill Down Waterfall PRO Drill Down Graph PRO Drill Down Combo PRO Drill Down Combo Bar PRO Drill Down Donut PRO Drill Down Pie PRO Drill Down TimeSeries PRO Drill Down Timeline PRO Drill Down Map PRO Drill Down Scatter PRO All Visuals

Report Examples Webinars Blog ZoomCharts Academy Visuals Gallery Documentation Custom Visual Development Subscribe to News

Custom Visual Development

Pricing About Us Partners Leave feedback Join PowerGroup EU Funding

ZoomCharts Assistance Contact Sales Contact Support FAQ
+44 204 577 3993
[email protected]

Ready to get in touch?

Contact our experts with any question about Power BI and ZoomCharts for Free!

Contact us

© 2025, Data Visualization Software Lab

U.S. Patents No. 11,645,343; 11,921,804; 12,346,389

Cookies
Privacy Policy
Global
Legal
Patent
warning

Error message

success

Success info: Done!

ZoomCharts AI Assistant

We noticed you're using an old OS version.

For the best experience, we recommend upgrading to ensure that all website features display correctly.

Cookie settings

We use necessary cookies for site functionality, as well as statistic, marketing, and preference cookies to enhance your experience. For more information and to manage your preferences, please visit our Cookie policy