1562
Airline Dashboard
Airline Dashboard
More Report pages
Report Author: Crystal Andrea Dsouza
1562
Share template with others
Report submitted for the FP20 Analytics ZoomCharts Challenge, January 2025. The report was built using the Airline Delays Dataset and includes ZoomCharts custom Drill Down PRO visuals for Power BI.
Author's description:
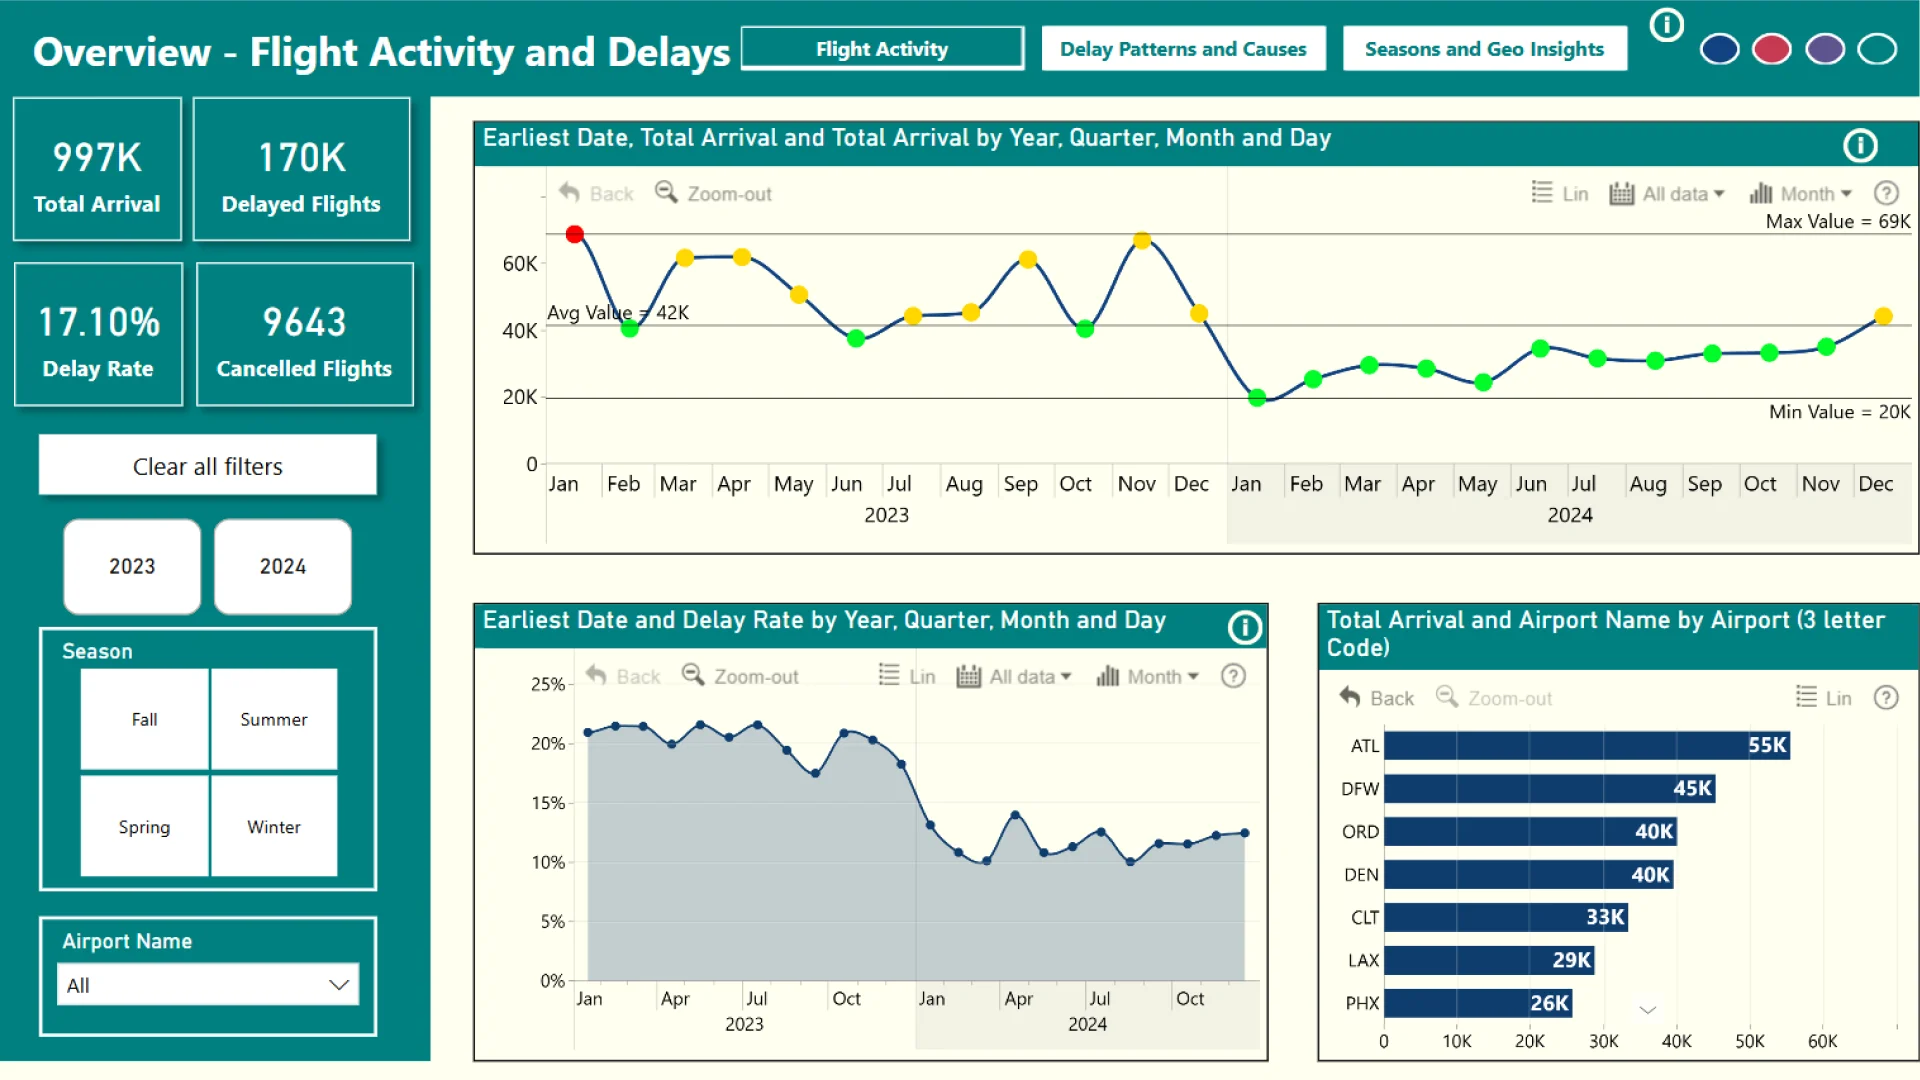
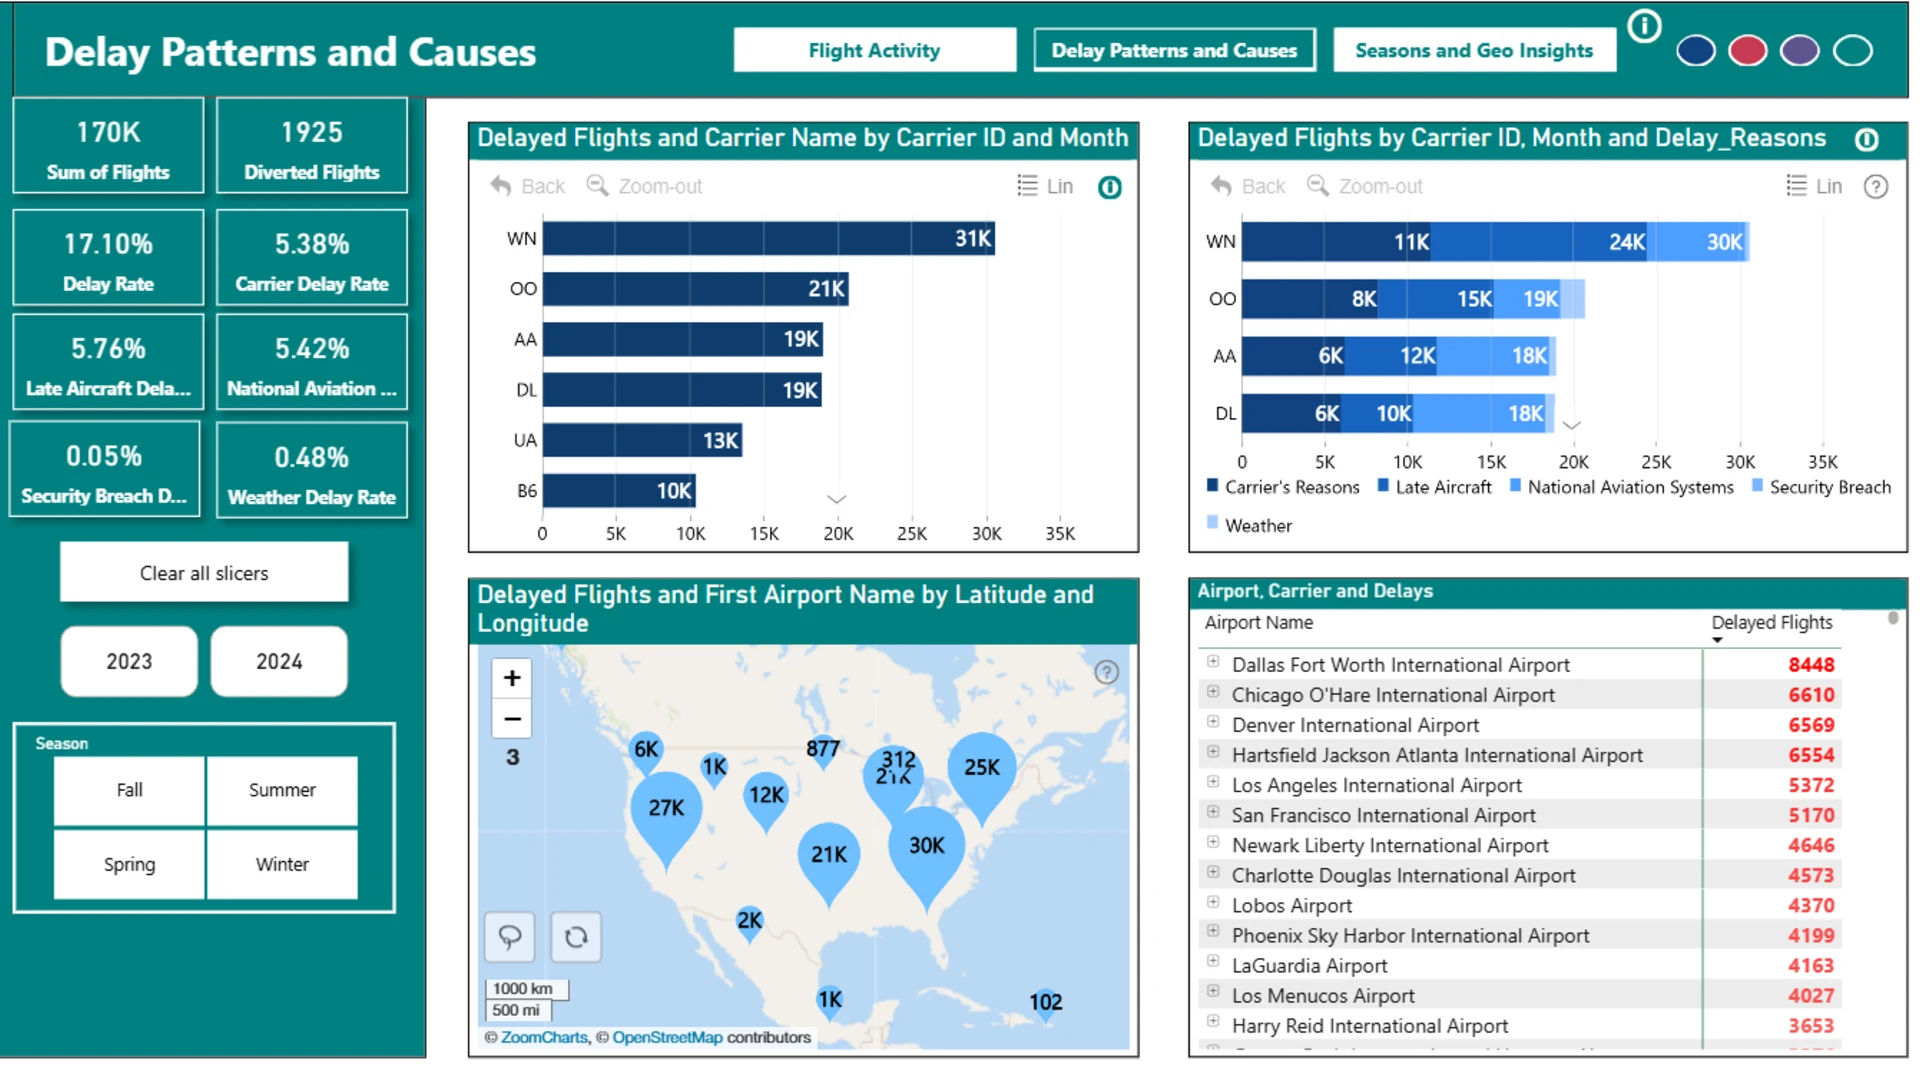
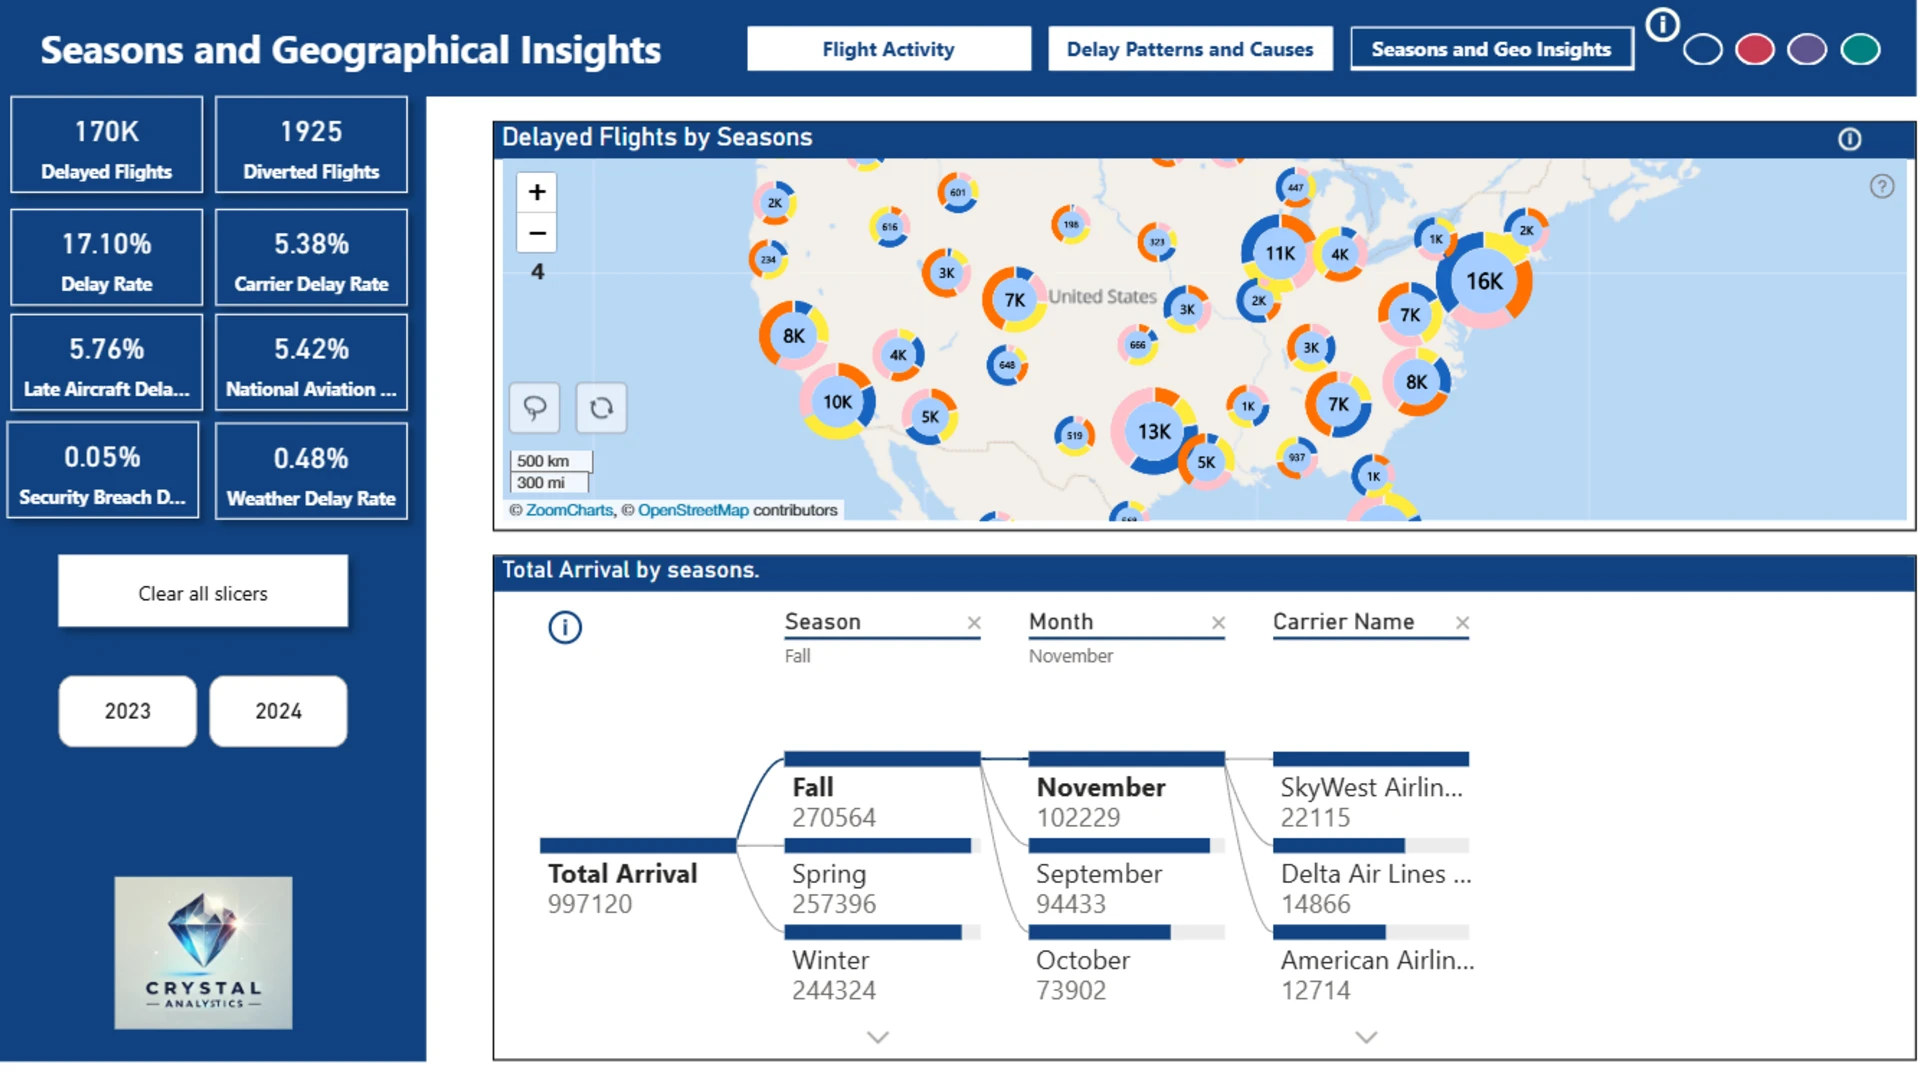
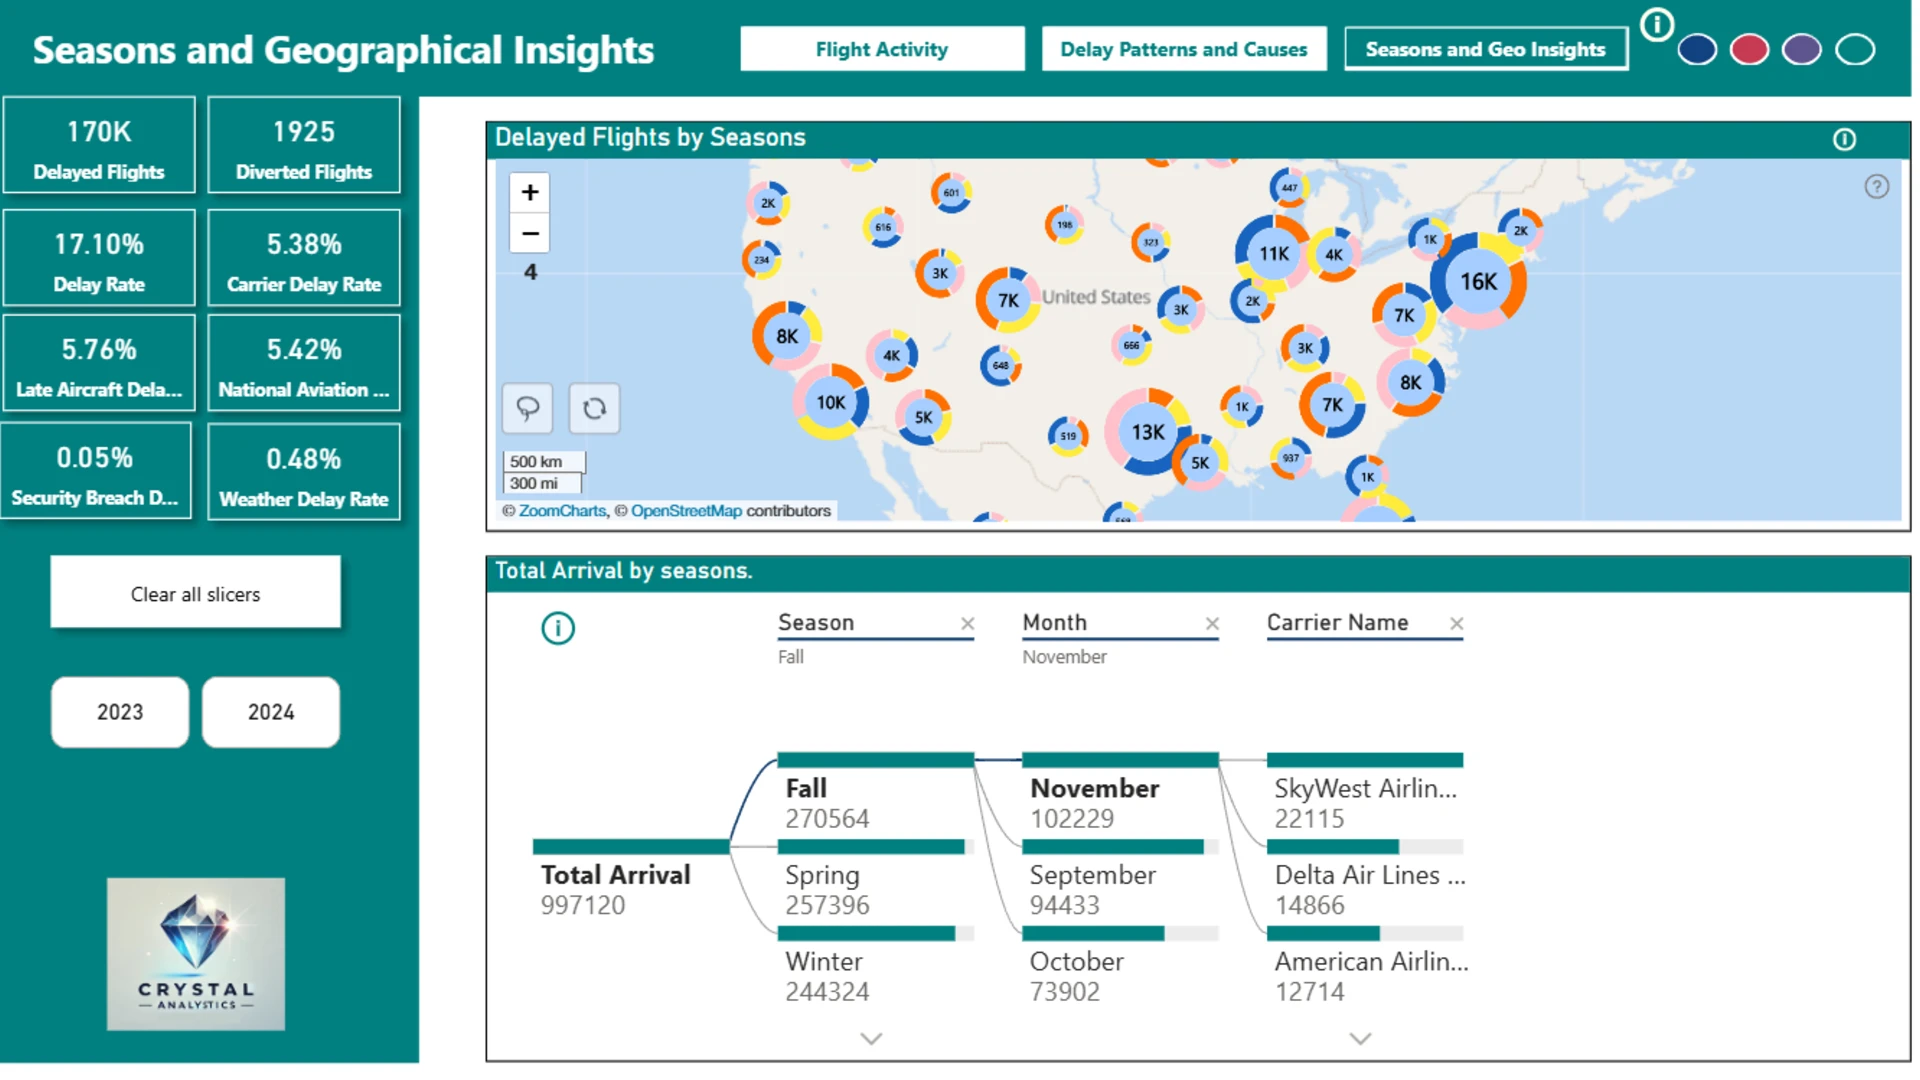
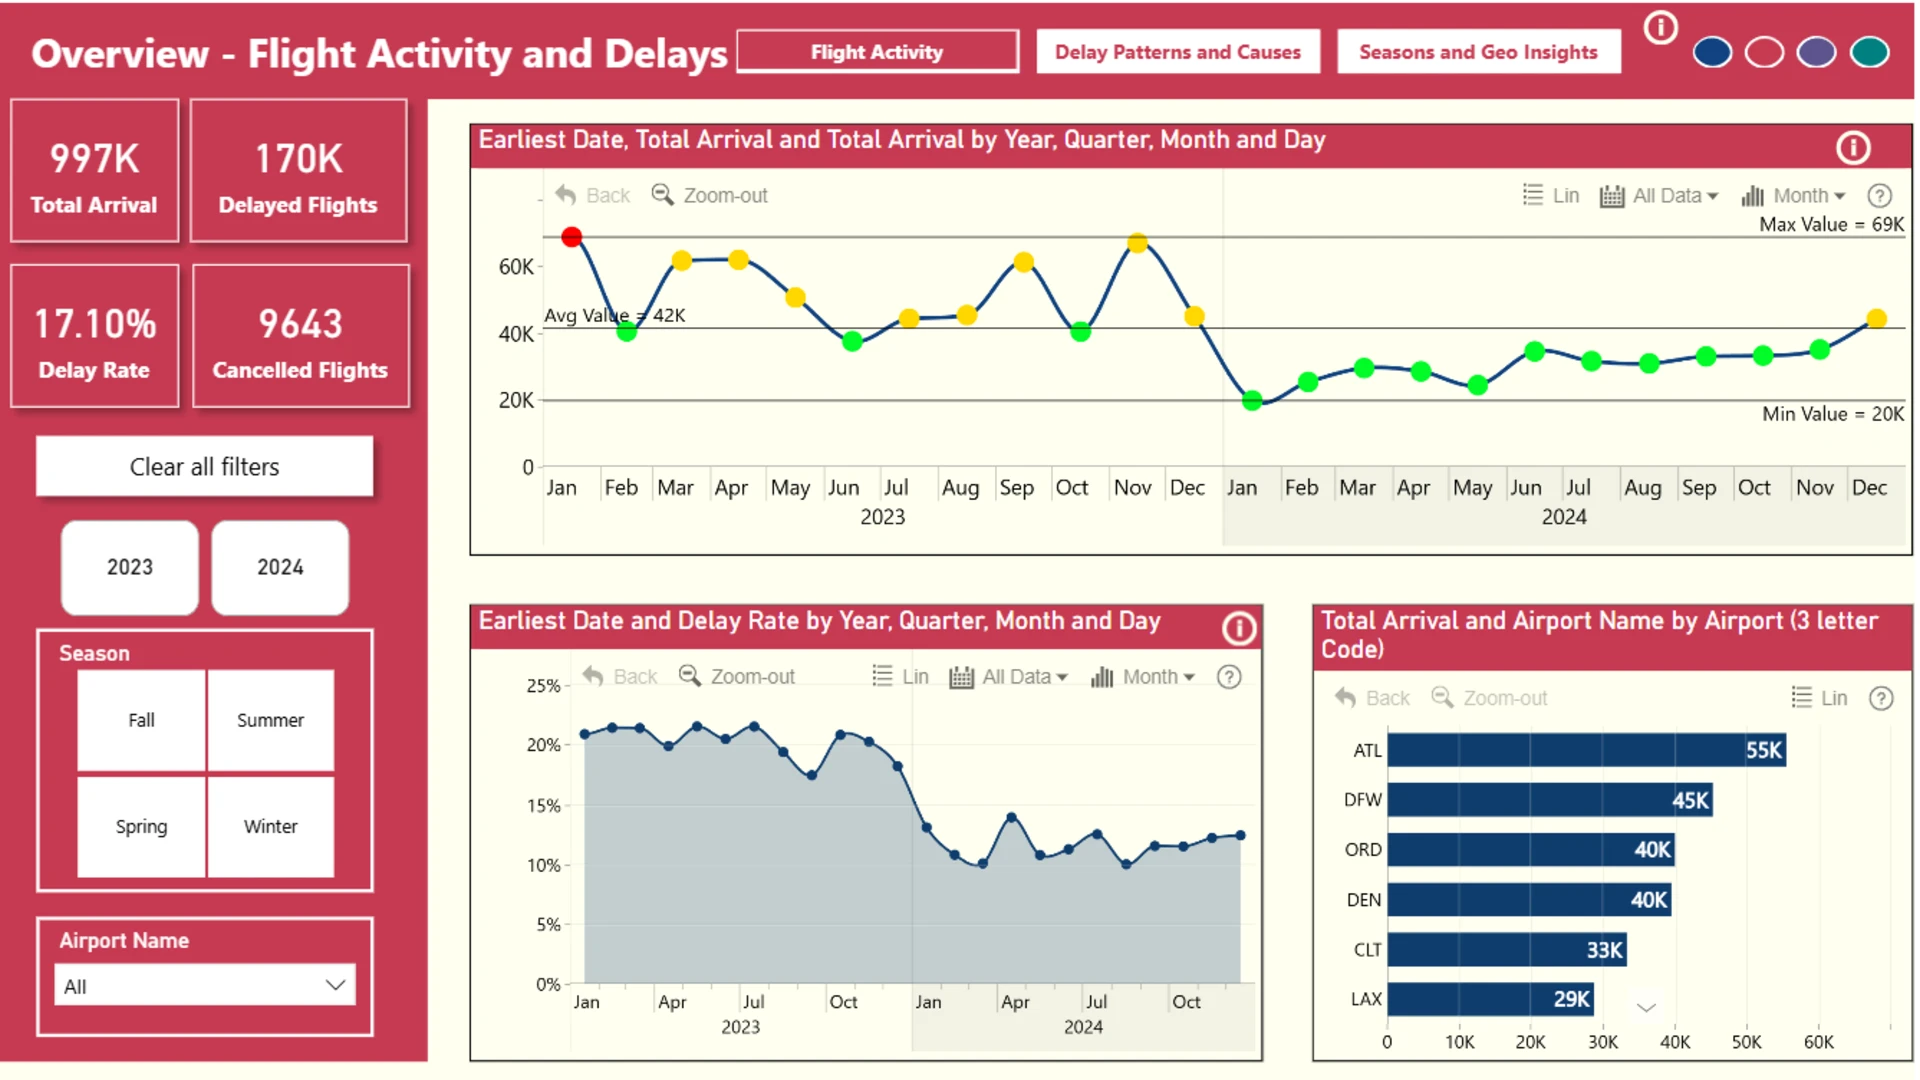
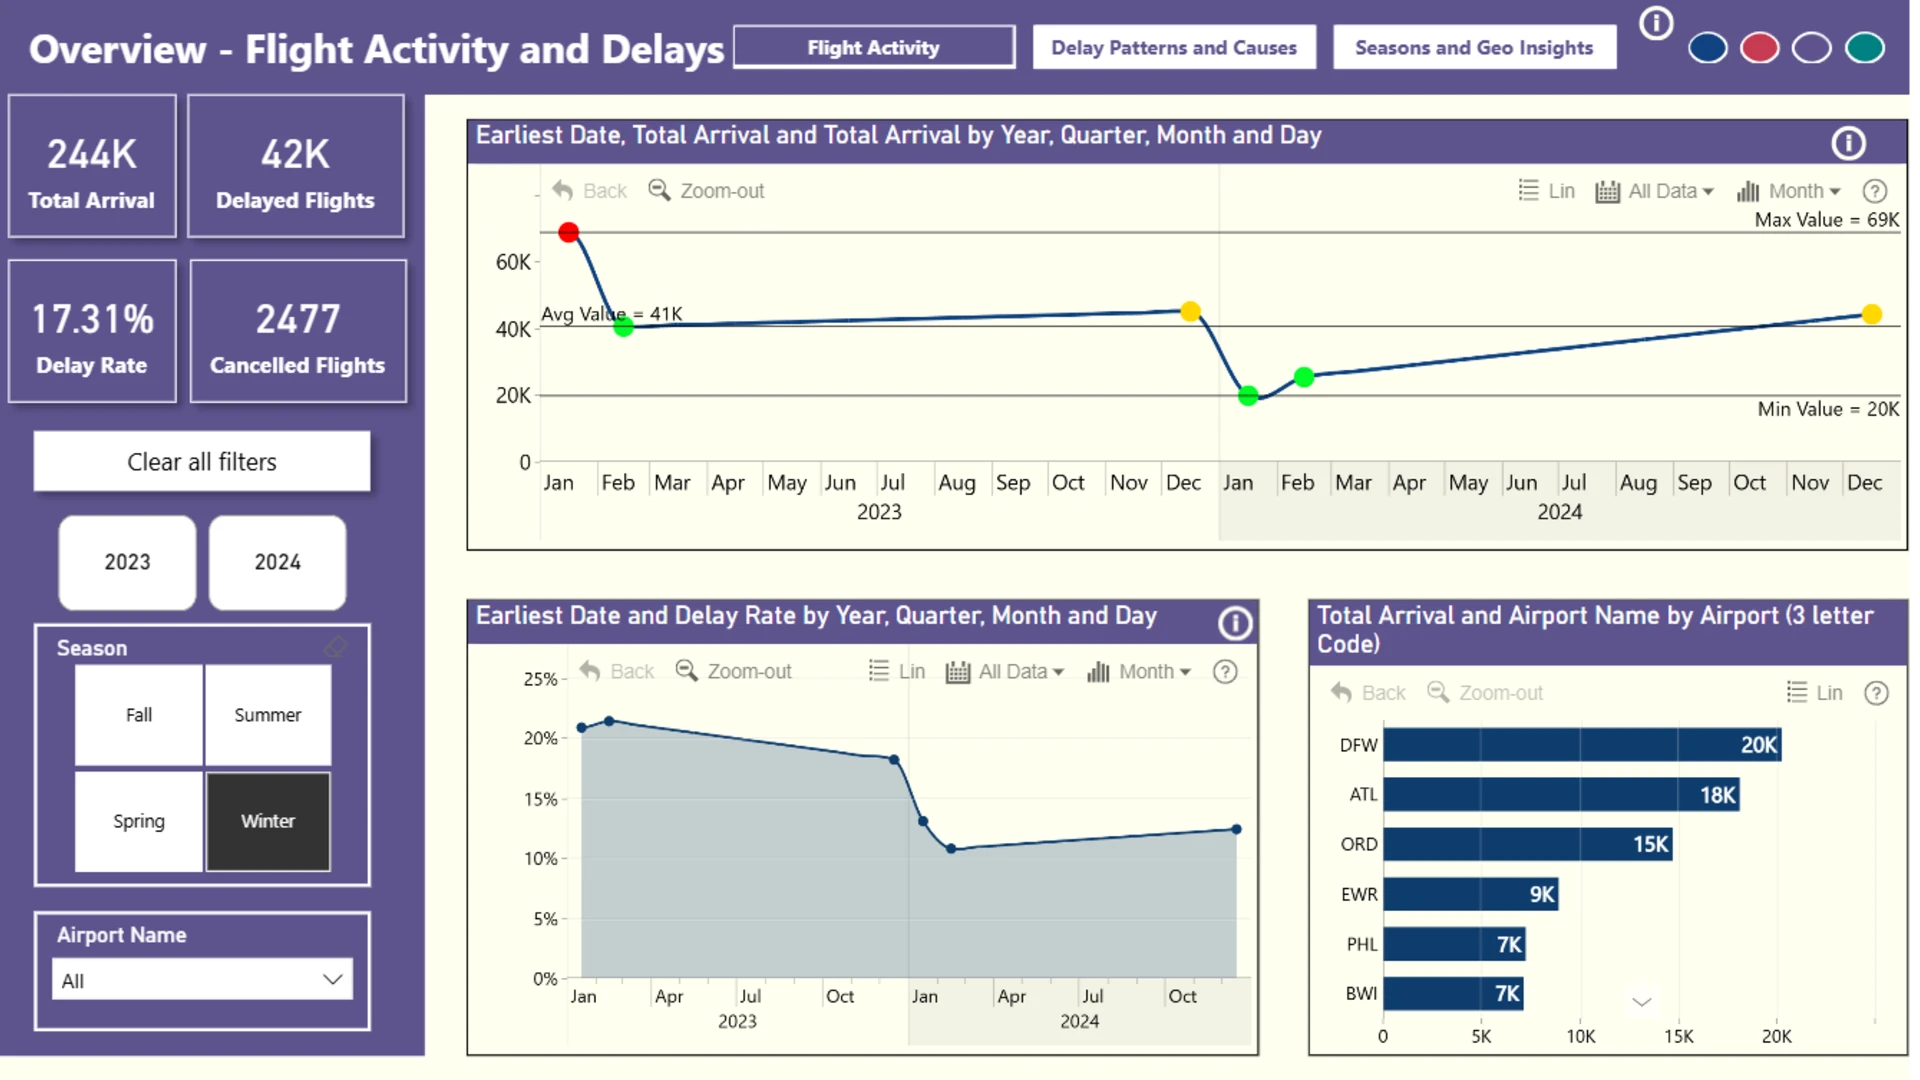
📊 Key Insights from the Report: 1️. The total arrival rate remained consistent across seasons, with Fall and Spring seeing slightly higher activity. 2️. Delay Patterns reveal that late aircraft and National Aviation Systems are the top reasons for flight delays. 3️. Airports like Dallas Fort Worth and Chicago O’Hare witnessed the highest number of delayed flights. 4️. Summer saw the lowest delay rates, providing opportunities for optimising airline schedules. 5️. The geographic data highlights significant clusters of delays in major U.S. airports.
4U Report Challenges
Participate in data challenges, build and submit reports to get free template downloads.
Join CommunityMobile view allows you to interact with the report. To Download the template please switch to desktop view.
Was this helpful? Thank you for your feedback!
Sorry about that.
How can we improve it?