Feel free to leave your vote:
1
Share template with others
Summary
Report submitted for Onyx Data DataDNA ZoomCharts Mini Challenge, December 2023. The report was built based on Christmas Sales and Trends dataset and includes ZoomCharts custom Drill Down PRO visuals for Power BI.
Author's description:
As I analyze the overall sale data of Christmas sale I discover insights such as:
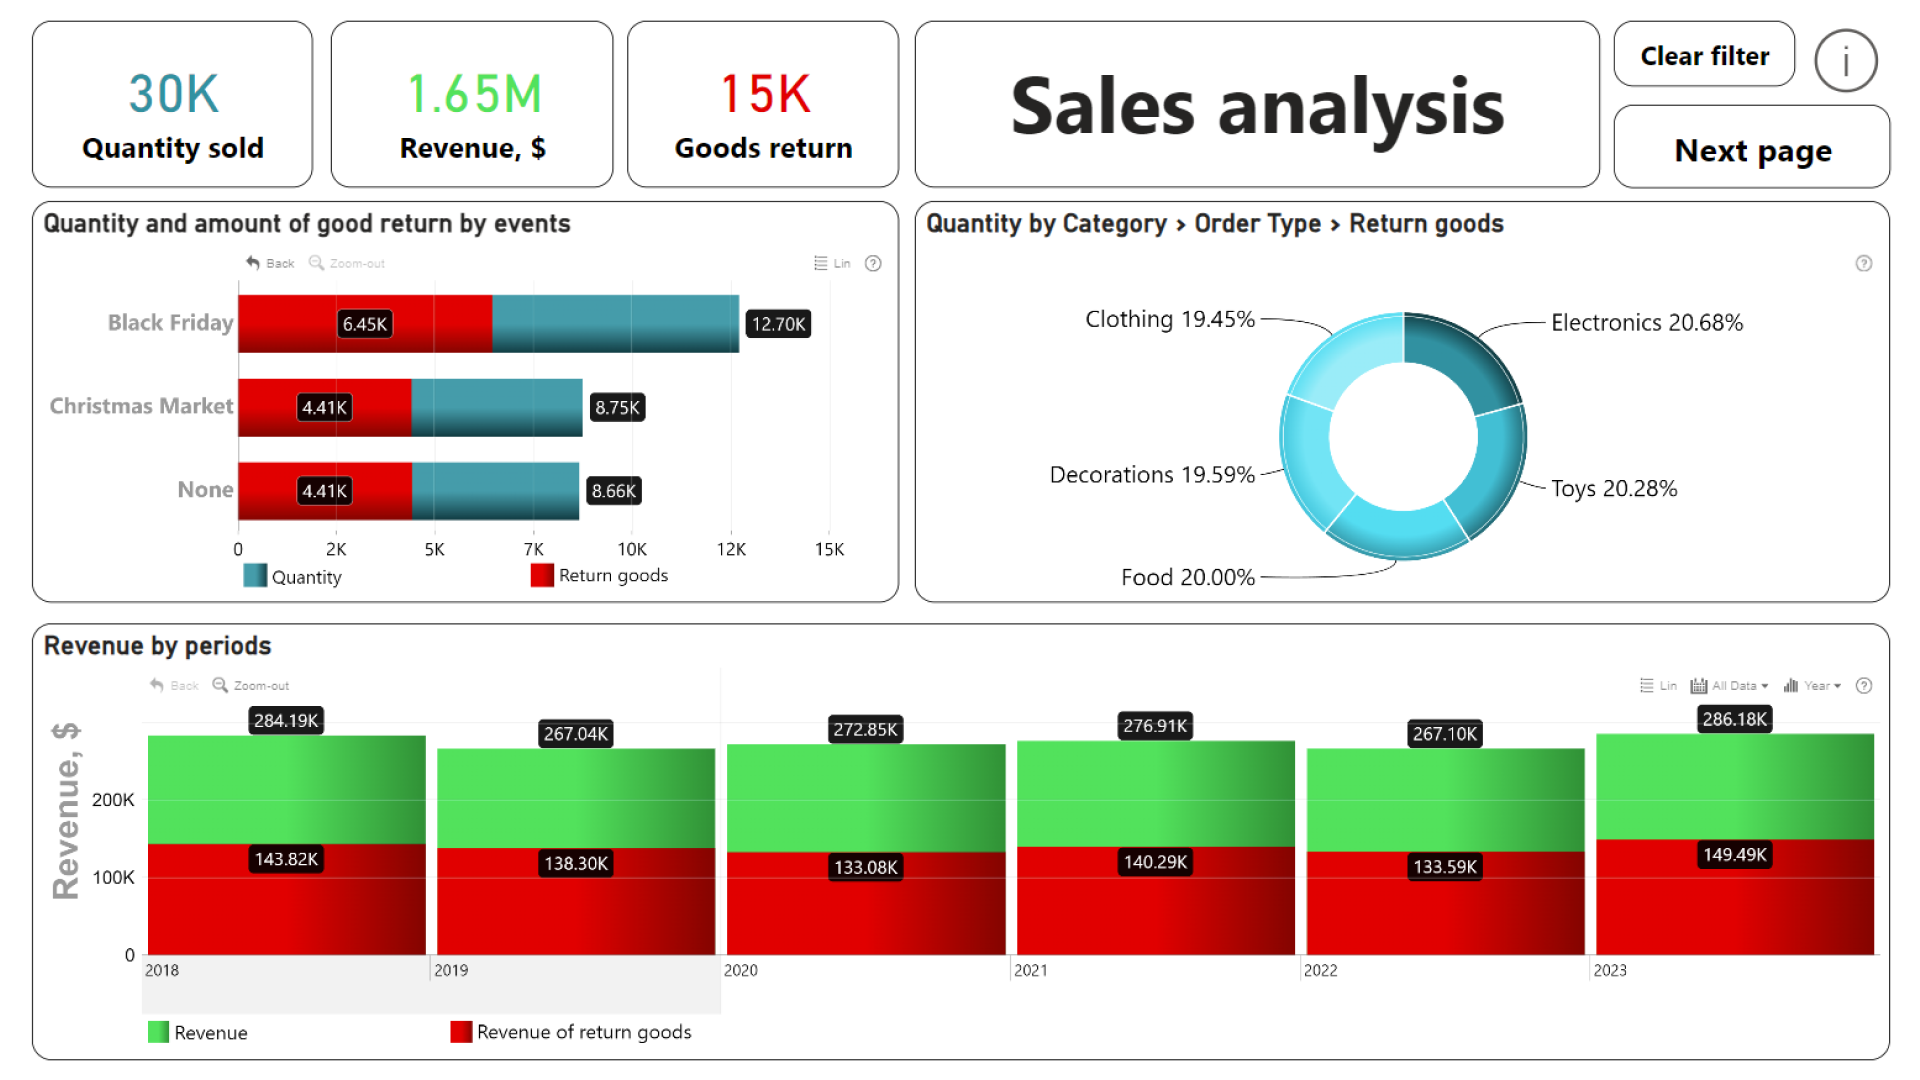
- Sale in Black Friday is highest then Christmas market and other occasions respectively. This could be due to the sale off promotions to attract customers of the stores.
- There is an increasing trend in online ordering as can be seen in the revenue. As opposite for the increasing trend of online order, offline or at store transaction is reducing every year this indicate the trend of customer to value their convenience even more throughout the time.
- Quantity of goods return account for approximately 50% of goods sold for every year and for all the occasion this could due to various reasons like long delivery time, unmatched goods quality, wrong products elements (colors, size, …).
- City 1, 13, 15 have seen a significant increase in revenue generate with the top city is City 13 then city 1 and 15 respectively as of 2023. This could be due to the development in economic situation and living standard of citizen lead to higher in demand.
ZoomCharts visuals used
Mobile view allows you to interact with the report. To Download the template please switch to desktop view.
