Feel free to leave your vote:
0
Share template with others
Summary
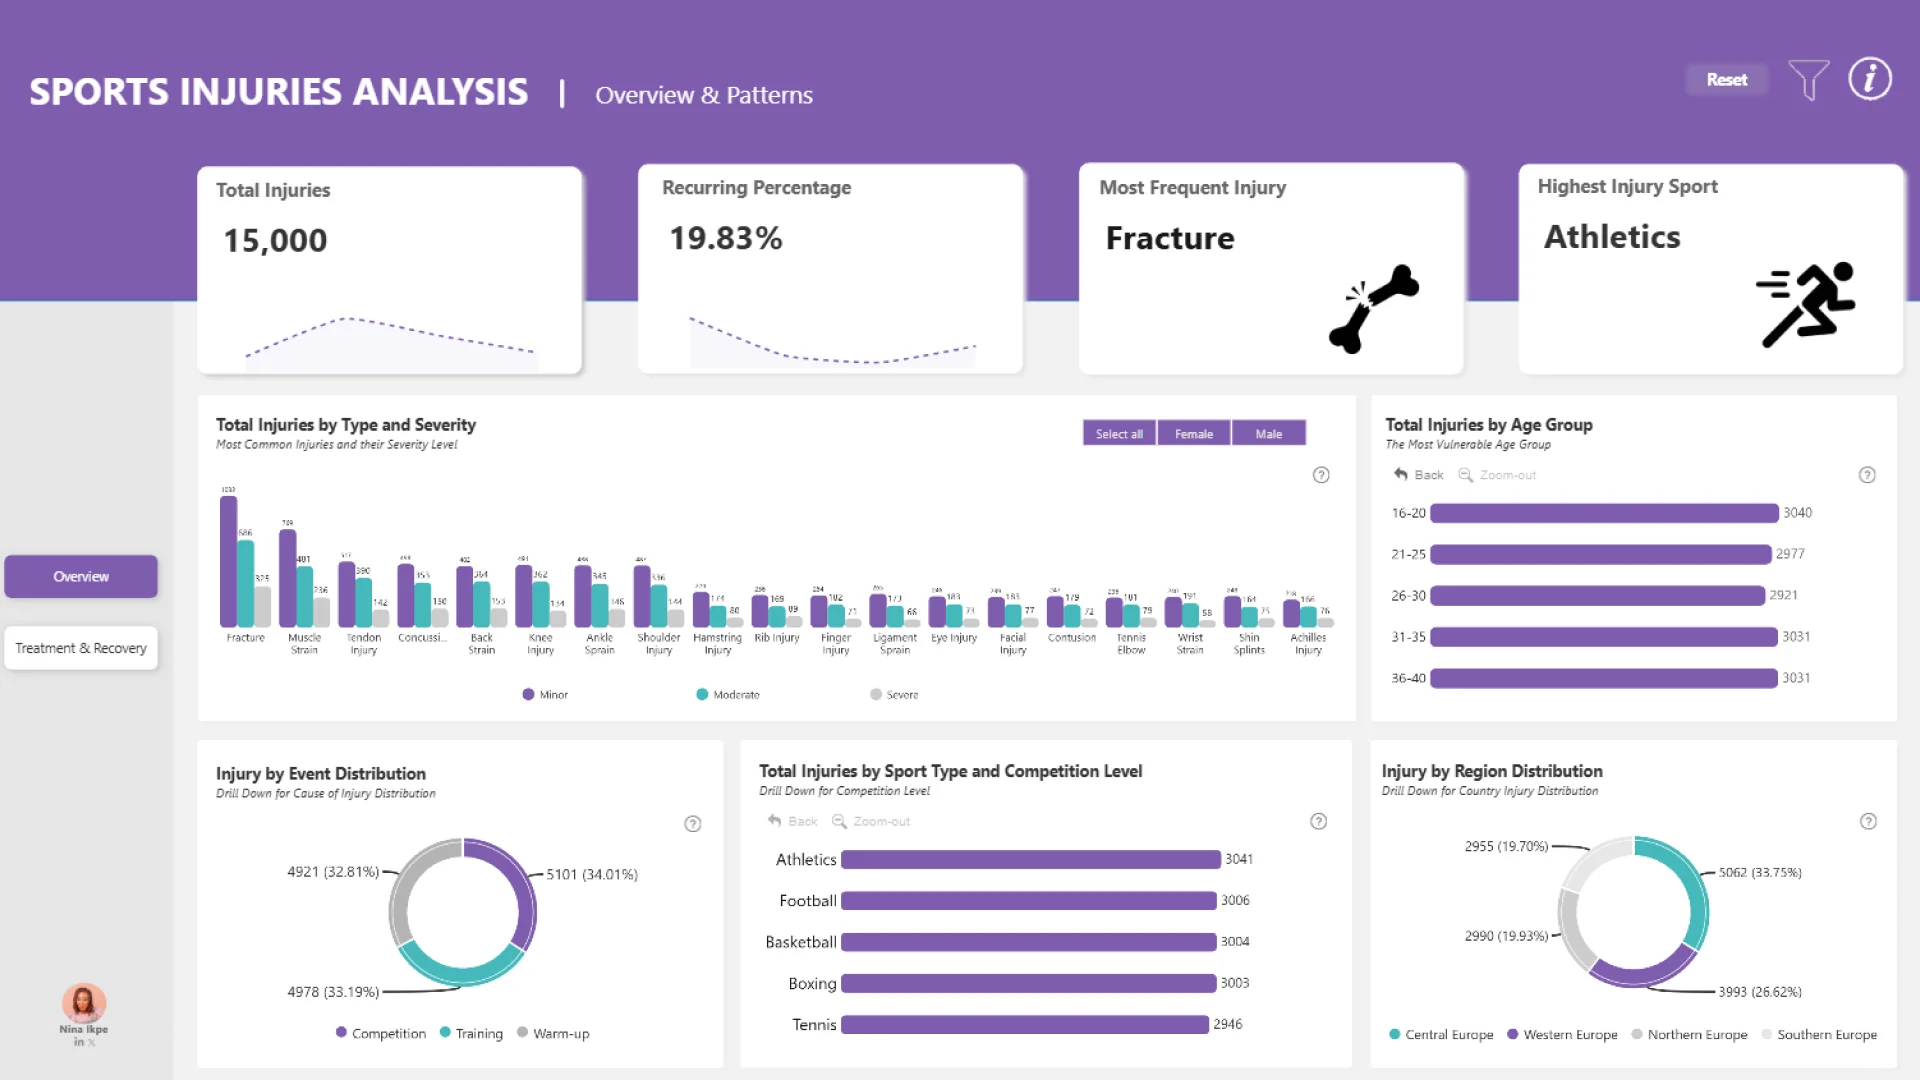
This Power BI report uses the Athlete Health and Injury dataset and features ZoomCharts Drill Down PRO custom visuals for Power BI. It was submitted to the FP20 Analytics ZoomCharts Data Challenge in August 2025.
Author's Description:
My submission for FP20 Analytics Challenge 29 explores injury risks in sports, uncovering patterns across age groups, regions, and competition intensity. The analysis highlights the most frequent injuries, high-risk sports, vulnerable demographics, and regions most affected. It also evaluates treatment effectiveness, recovery times, and success rates, while identifying teams with varying levels of injury risk.
Mobile view allows you to interact with the report. To Download the template please switch to desktop view.