Feel free to leave your vote:
0
Share template with others
Summary
Report submitted for FP20 Analytics ZoomCharts Challenge 19 (September 2024). The report was built with the E-commerce KPI Analysis dataset and includes ZoomCharts custom Drill Down PRO visuals for Power BI.
Author's description:
Both dashboards show: Annual Profit Growth Total Sales Growth Total Corporate Sales Growth Total Sales per Market.
Key Findings: 2020, 2021, and 2023 had a profit margin above 15% with 2021 having the greatest profit margin at 18.5%.
All years showed a total sales growth from the previous year above or equal to 20% with 2023 having the highest dollar growth amount at $421,897 and 2022 having the highest percentage growth at 26.0%
No years showed a total sales growth from the previous year above or equal to 30% with 2023 having the highest dollar growth amount at $253,042 and 2022 having the highest percentage growth at 26.6%
4/5 of the global markets reach an amount above or equal to $400k by 2023, with the highest market being Asia Pacific at $606,179 and the lowest being LATAM at $434,586. The Africa market remains at $163,624.
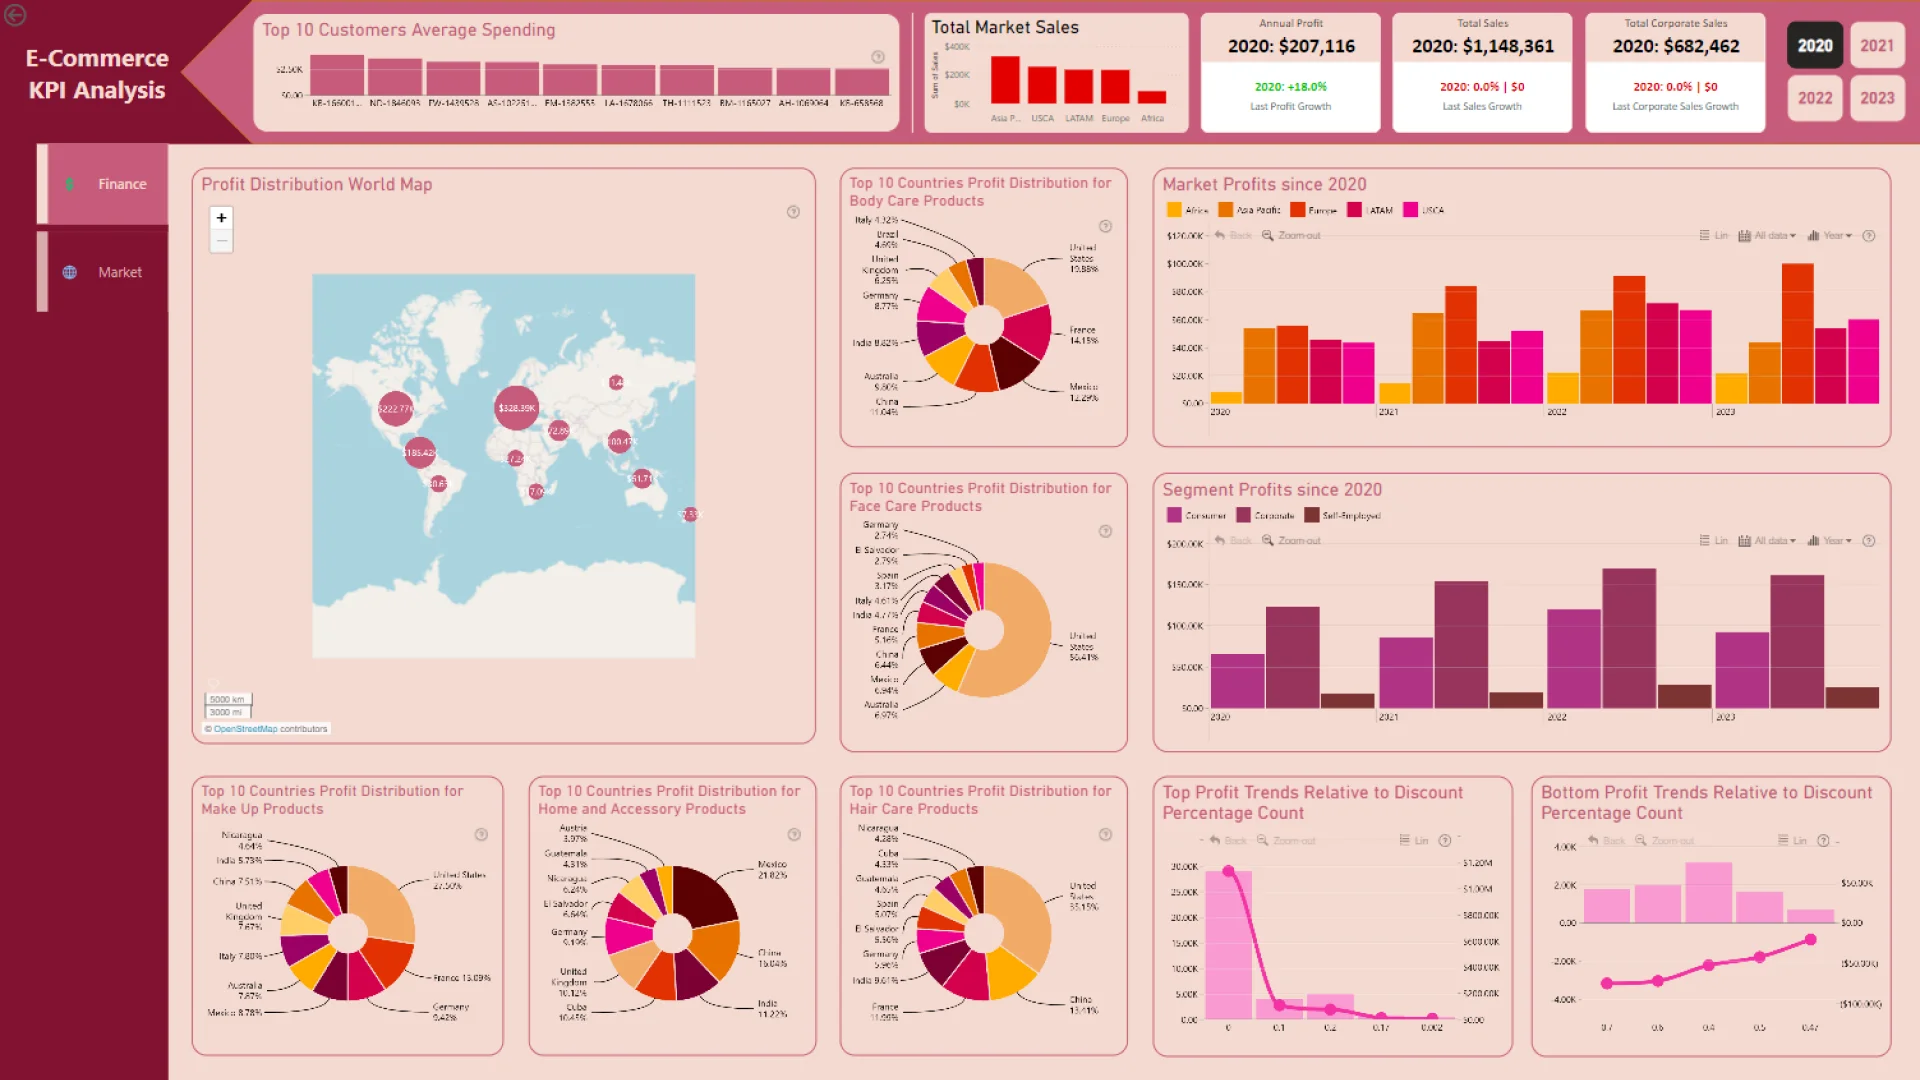
On my finance dashboard, I focused on: Top 10 Customers Average Spending Profit Distribution in World Map Country Profit Distribution by Category Market Profits since 2020 Segments Profits since 2020 Discount Percentage Count Relative to Profit Trends
Key Findings:
- The top 10 customers spent between $3.82K and $2.55K, with 2 from the US.
- Central US, Western Europe, and Central America dominate in profit.
- US leads profit in all categories except Home and Accessories, where Mexico dominates.
- A correlation exists between low discounts (0%-20%) and higher profits.
On my market dashboard, I focused on: Segment Quantity Trends Best Seller of Categories/Subcategories/Products since 2020 Top 10 Highest Spending Customers in each Country Market Profit/Sales Distribution Market Categories/Subcategories/Products Profit/Sales since 2020
Key Findings:
- Body Care is the best-selling category (2K products), while Face Care is the lowest (231 products).
- The Herbal Essence Bio product leads with 2K units sold.
- US customers consistently spend the most.
- Profit trends slowed or decreased in 2022, despite sales growth.
A big thank you to @FP20Analytics, Federico Pastor, and @ZoomCharts for the fantastic opportunity, insightful webinar, and powerful visualization tools that helped make this report more interactive and engaging!
#DataAnalytics #FP20Challenge #PowerBI #ZoomCharts
ZoomCharts visuals used
Mobile view allows you to interact with the report. To Download the template please switch to desktop view.
