Feel free to leave your vote:
1
Share template with others
Summary
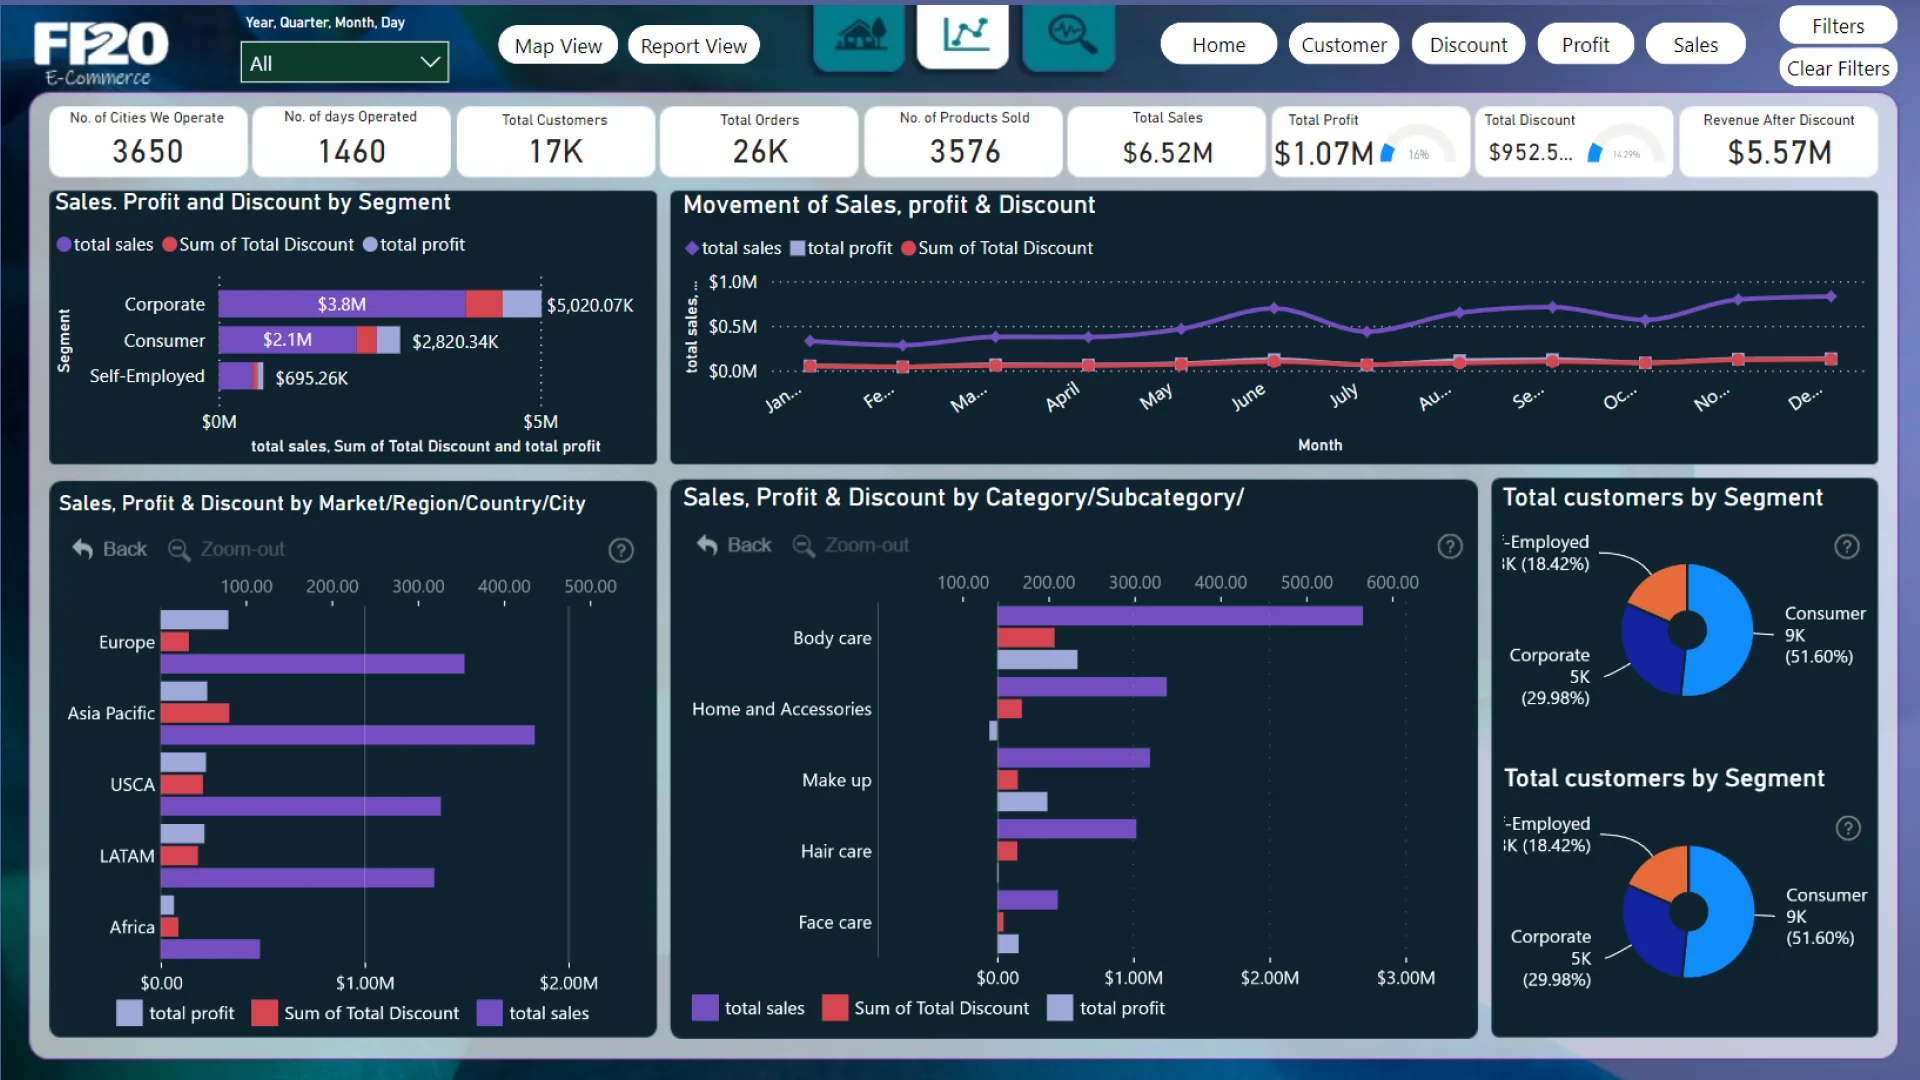
Report submitted for FP20 Analytics ZoomCharts Challenge 19 (September 2024). The report was built with the E-commerce KPI Analysis dataset and includes ZoomCharts custom Drill Down PRO visuals for Power BI.
Author's description:
This is the FP20 E-Commerce KPI dashboard which is very user friendly and allows the end users to easily find answers for the below questions and more:
-What were the most profitable segments from 2020 to 2023?
-Can we have a map visual to interact with locations to see the profit distribution?
-What were the most profitable markets since 2020?
-What were the best selling products since 2020?
-Following above, can we also view the best selling categories and subcategories?
-In each market, can we view the sales trend of each product/category/subcategory from 2020 to 2023?
-In each market, can we view the profits trend of each product/category/subcategory from 2020 to 2023?
-Did we have a good discount strategy last a few years?
-Can we list top 10 customers who spent most from each country every year?
-Which countries contributed most profits to each category?
Mobile view allows you to interact with the report. To Download the template please switch to desktop view.