Feel free to leave your vote:
1
Share template with others
Summary
Report submitted for Onyx Data DataDNA ZoomCharts Mini Challenge, May 2024. The report was built based on Tech Support Analysis dataset and includes ZoomCharts custom Drill Down PRO visuals for Power BI.
Author's description:
Hello! this is my submission to the Onyx Data May 2024 Challenge.
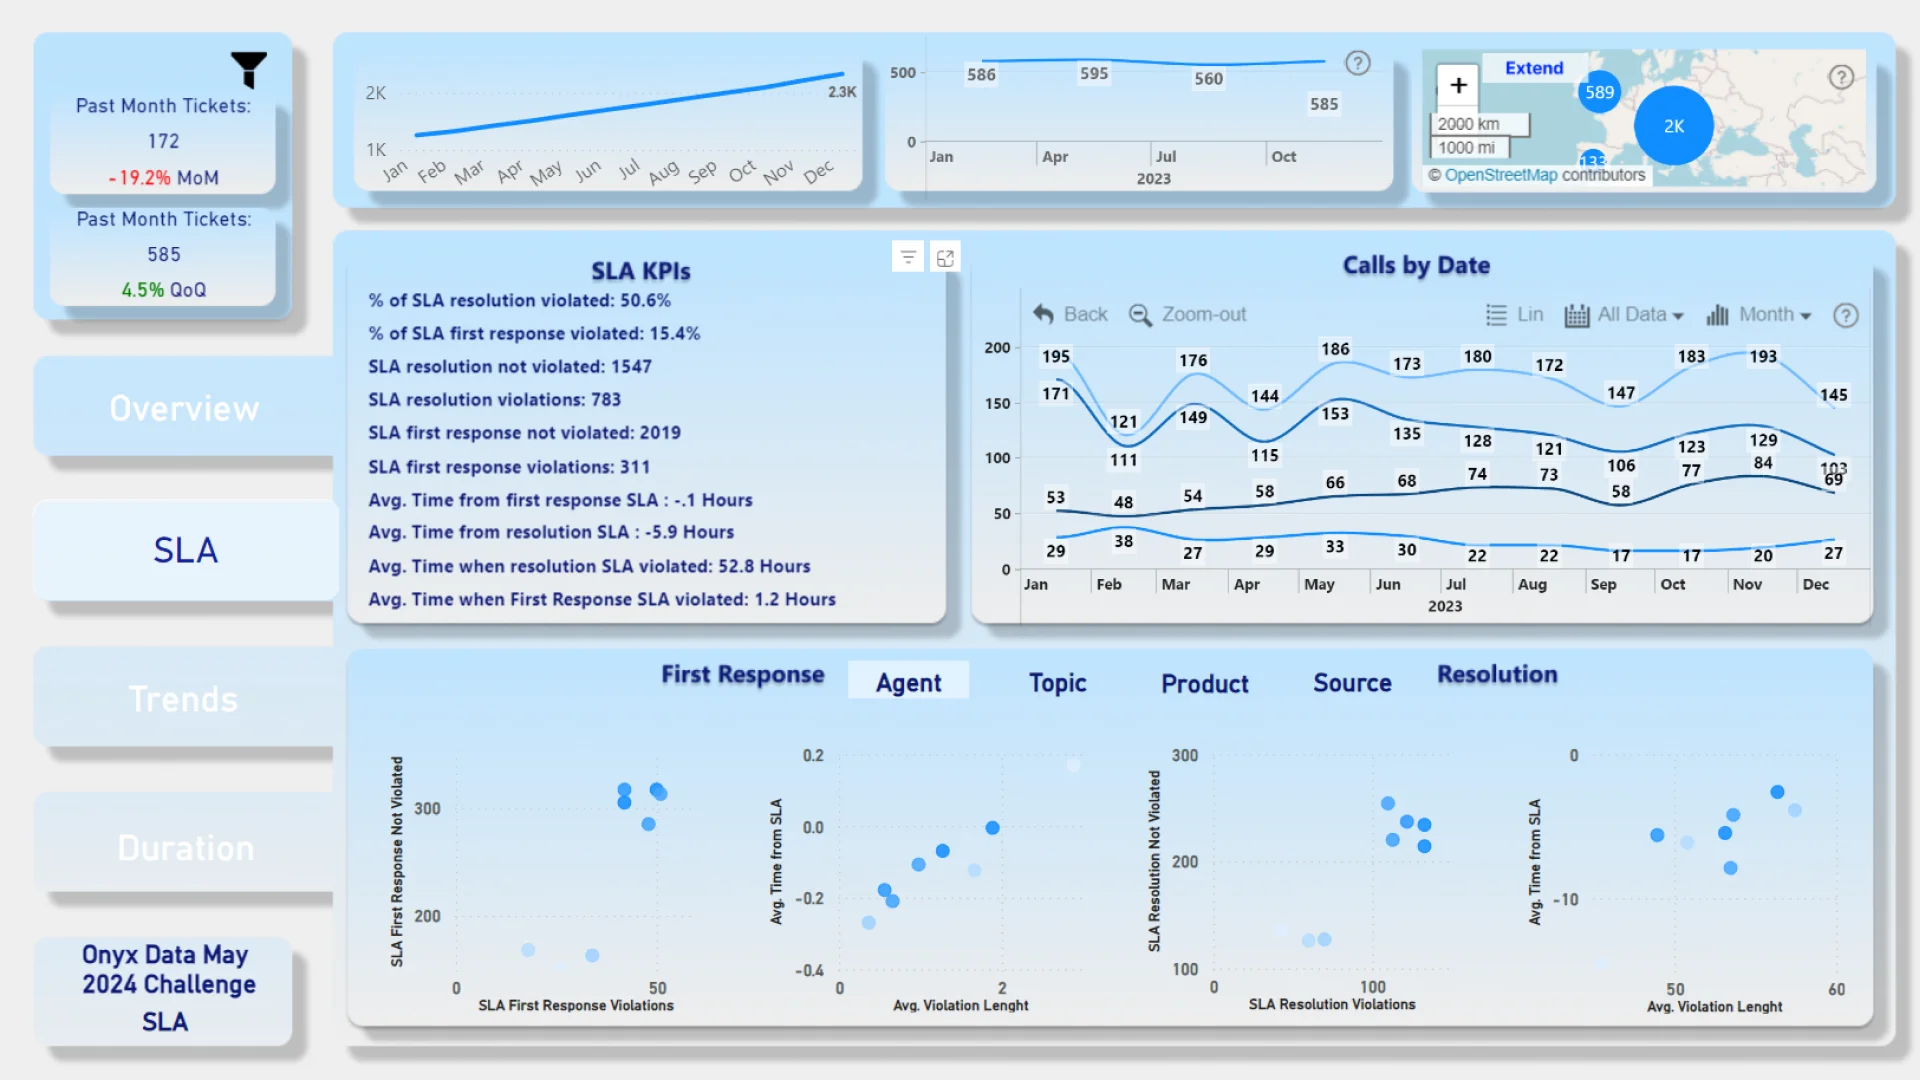
The top left section features dynamic filter panel for broader insights, a MoM and QoQ views for tickets. The bar on right displays cumulative ticket amount on left and on the middle tickets by quarter. Next to it the map acts as a region filter and displays ticket amount by region.
The Report has 4 views for different insight.
The first view is an overview with insight about agents, ticket topics, product categories and contact source. On bottom left, a KPI panel displays daily, weekly and monthly volumes and average ticket length. The second view displays insights about service level agreements for first response and resolution. The left KPI section shows SLA violation data for number of violations, violation length and % of violations compared to tickets within SLA. The right line visual displays SLA violations in a chosen time interval. The bottom section displays separate views for SLA violations for agent, topic, product, and source. The Third view displays ticket trends. The top section features insight by customer’s country in a given interval. The second line visual below displays ticket trends by chosen interval and measure.
You can choose the measure from different time intelligence such as daily, weekly and monthly averages or view SLA data for resolution and first response. The bottom right visual displays ticket amounts for different topics. You can compare topics one by one or all at once.
The fourth and final view displays data about ticket duration. The first visual displays tickets by creation hour. The visual below displays tickets by year, month, week and day. The bottom timeline shows individual tickets by their length, creation and close date and if they violated SLA or not. The final gauge groups tickets by their length.
Mobile view allows you to interact with the report. To Download the template please switch to desktop view.
