Feel free to leave your vote:
12
Share template with others
Summary
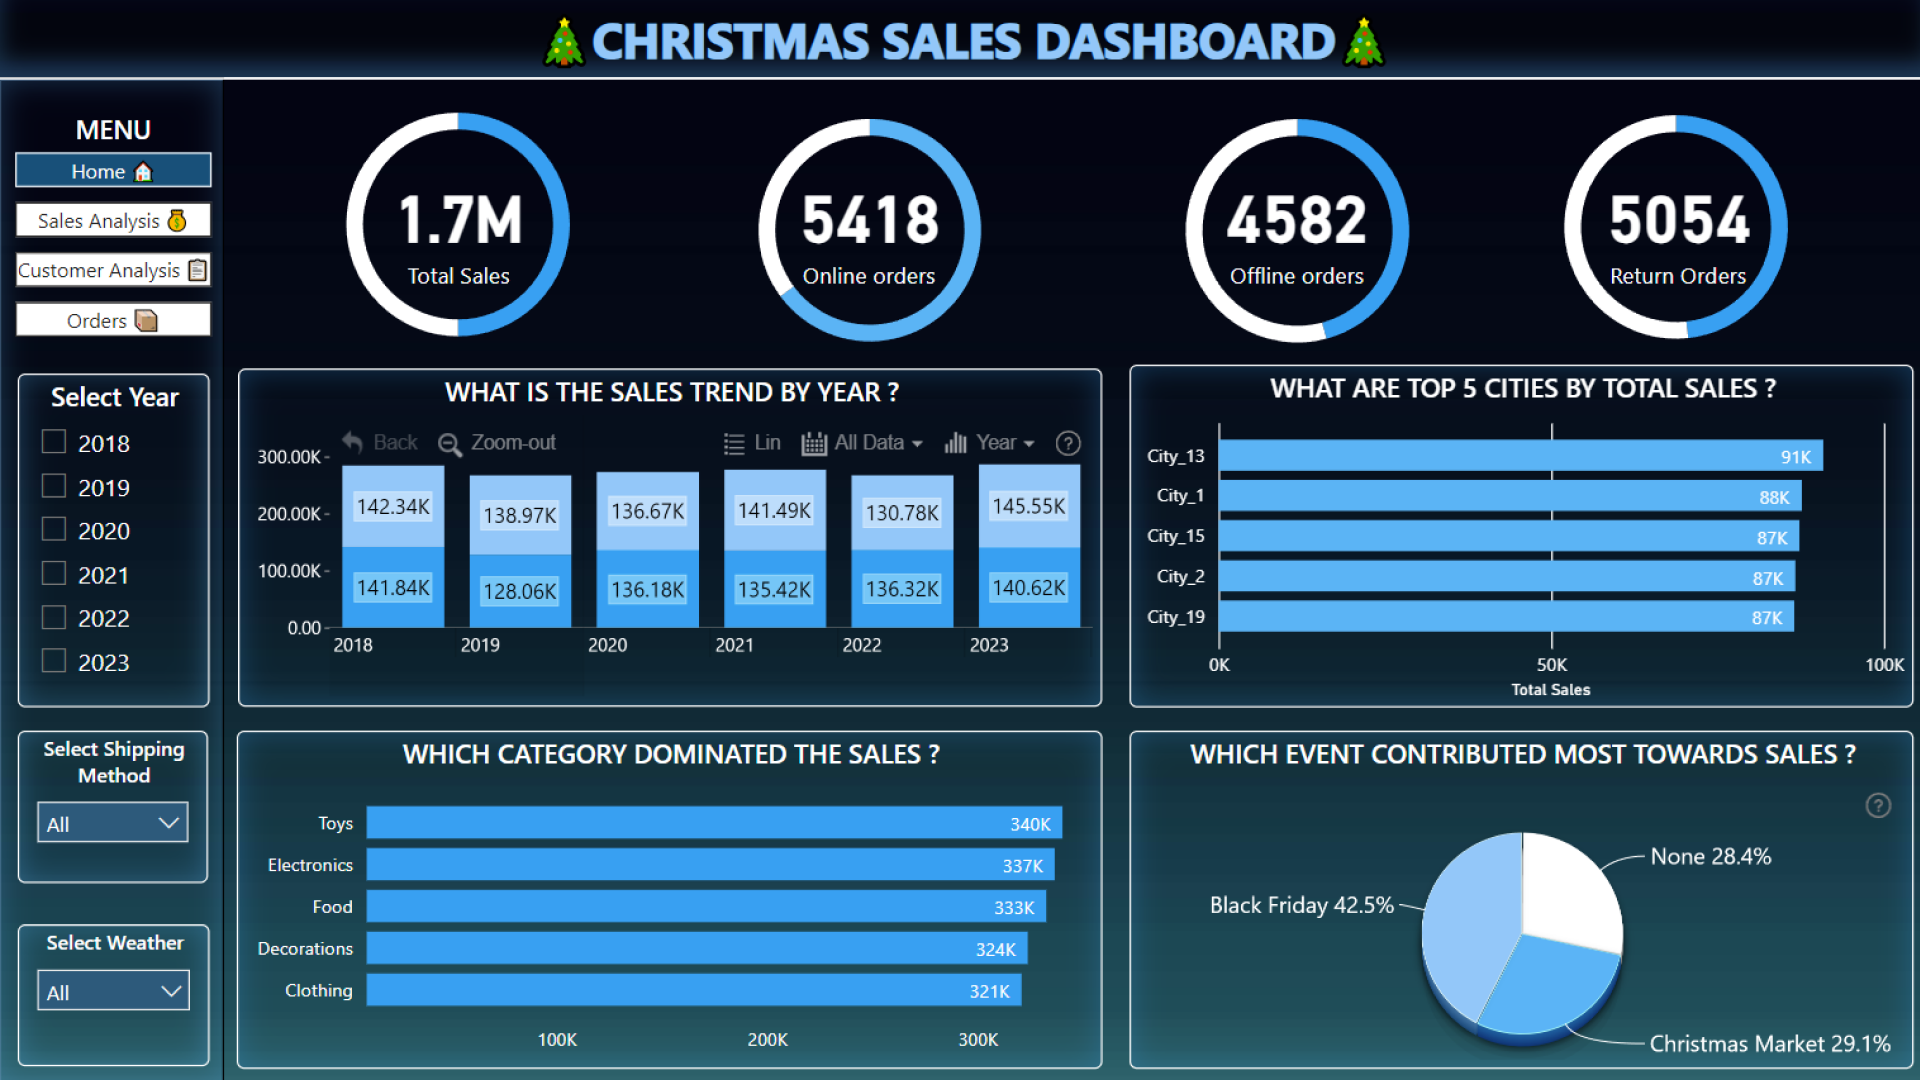
Report submitted for Onyx Data DataDNA ZoomCharts Mini Challenge, December 2023. The report was built based on Christmas Sales and Trends dataset and includes ZoomCharts custom Drill Down PRO visuals for Power BI.
Author's description:
Key Insights:
- In 2023 year with the highest revenue and profit followed by 2018.
- Toys category has the highest contribution towards Sales (approx. 21%).
- The total sales for the - Out of 10k orders (Both Online and Offline), we had 5k orders for return - This is an area, that needs immediate attention.
- The average customer rating for all the segments was approximately (3.0)
- CustomerID - 474 has contributed the most towards sales, spending around 7.8k.
- Offline orders have maximum returns (2323).
Focussing on sales and profit only won't help to grow the business every time. Along with this, equal weightage needs to be given to efficient delivery systems, and inventory management. Lower delivery days will aid in increasing customer experience, and promotion offers will have a high chance of Increasing sales.
Mobile view allows you to interact with the report. To Download the template please switch to desktop view.