Feel free to leave your vote:
0
Share template with others
Summary
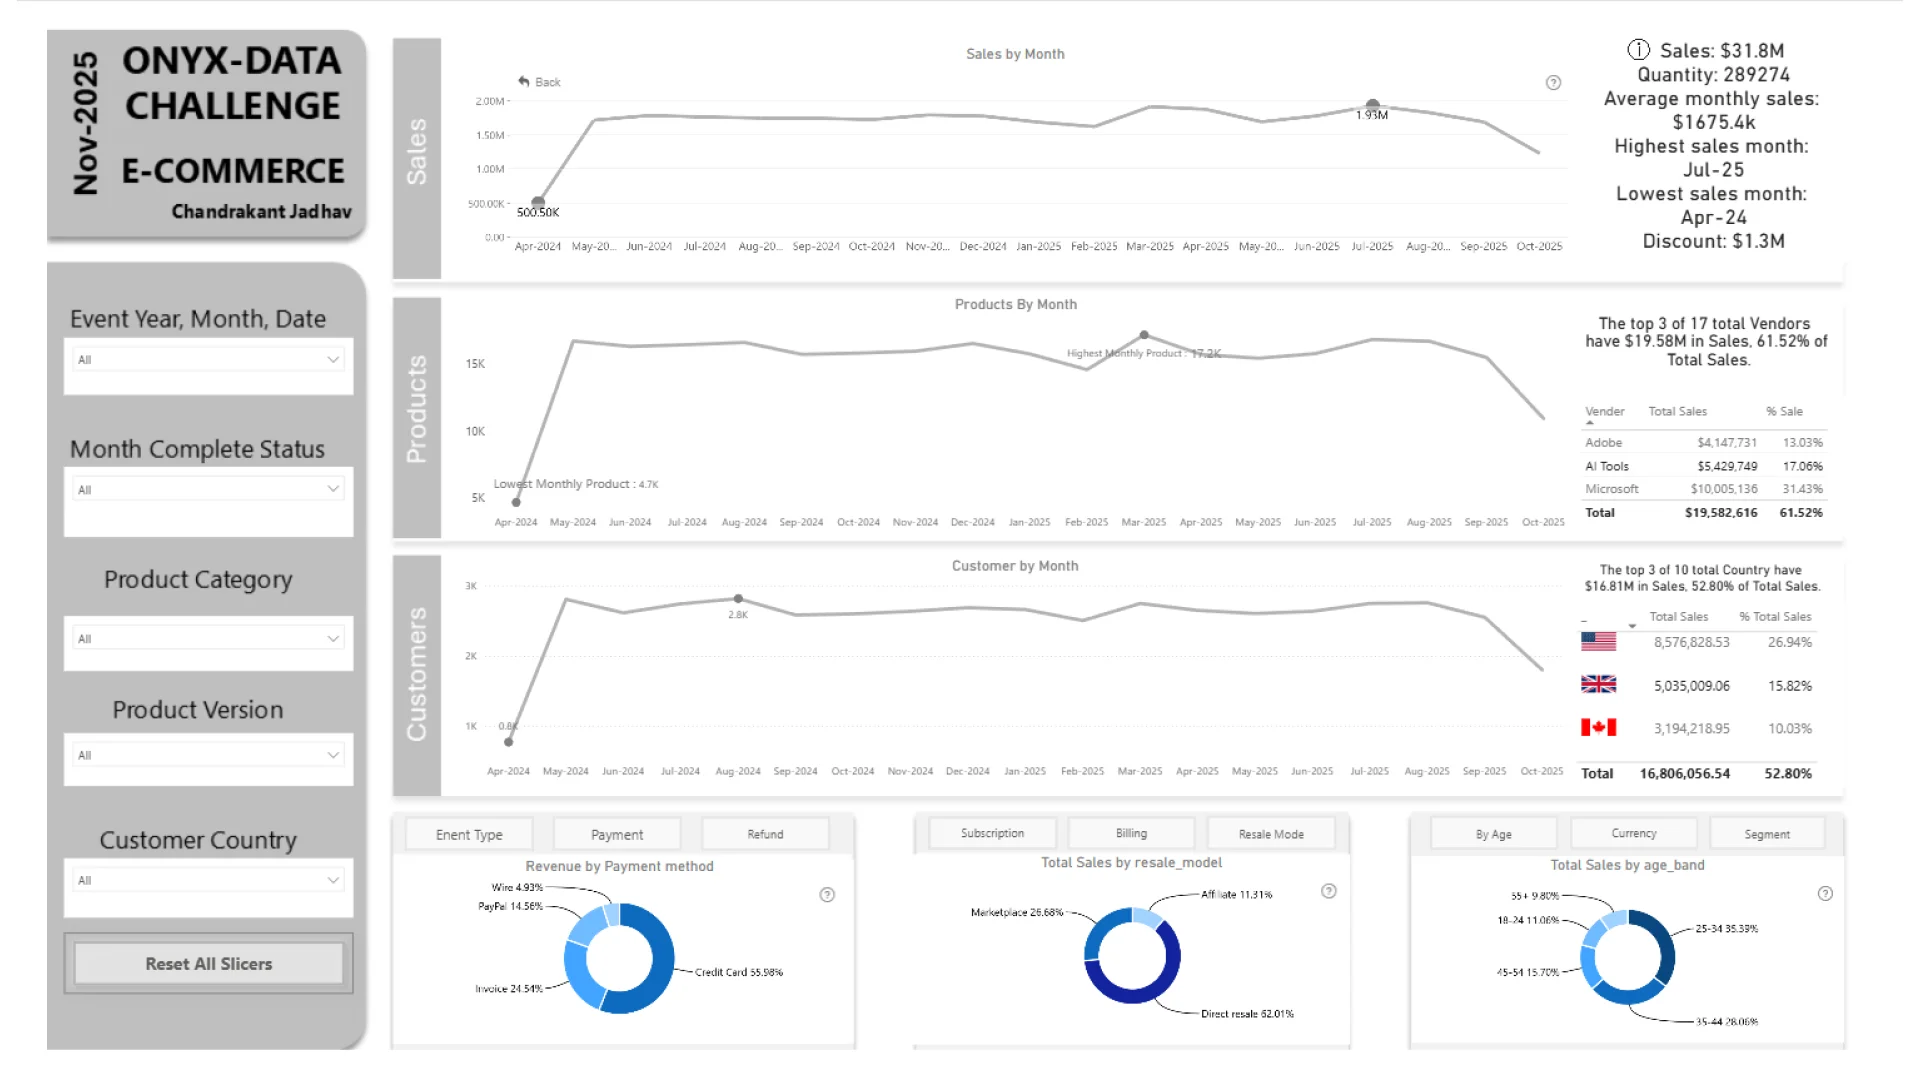
This Power BI report uses the e-commerce sales dataset from a global software retailer that sells subscriptions and add-ons across analytics, design, collaboration, and AI. The report features ZoomCharts Drill Down PRO custom visuals for Power BI. It was submitted to the Onyx Data DataDNA ZoomCharts Mini Challenge in October 2025.
Author description:
For this challenge, I’ve taken inspiration from the beautifully designed dashboard created by Tiffany Effinger for the Maven Northwind Challenge (June 2023), adapting its clean structure and storytelling approach to suit this dataset.
Mobile view allows you to interact with the report. To Download the template please switch to desktop view.