Feel free to leave your vote:
27
Share template with others
Summary
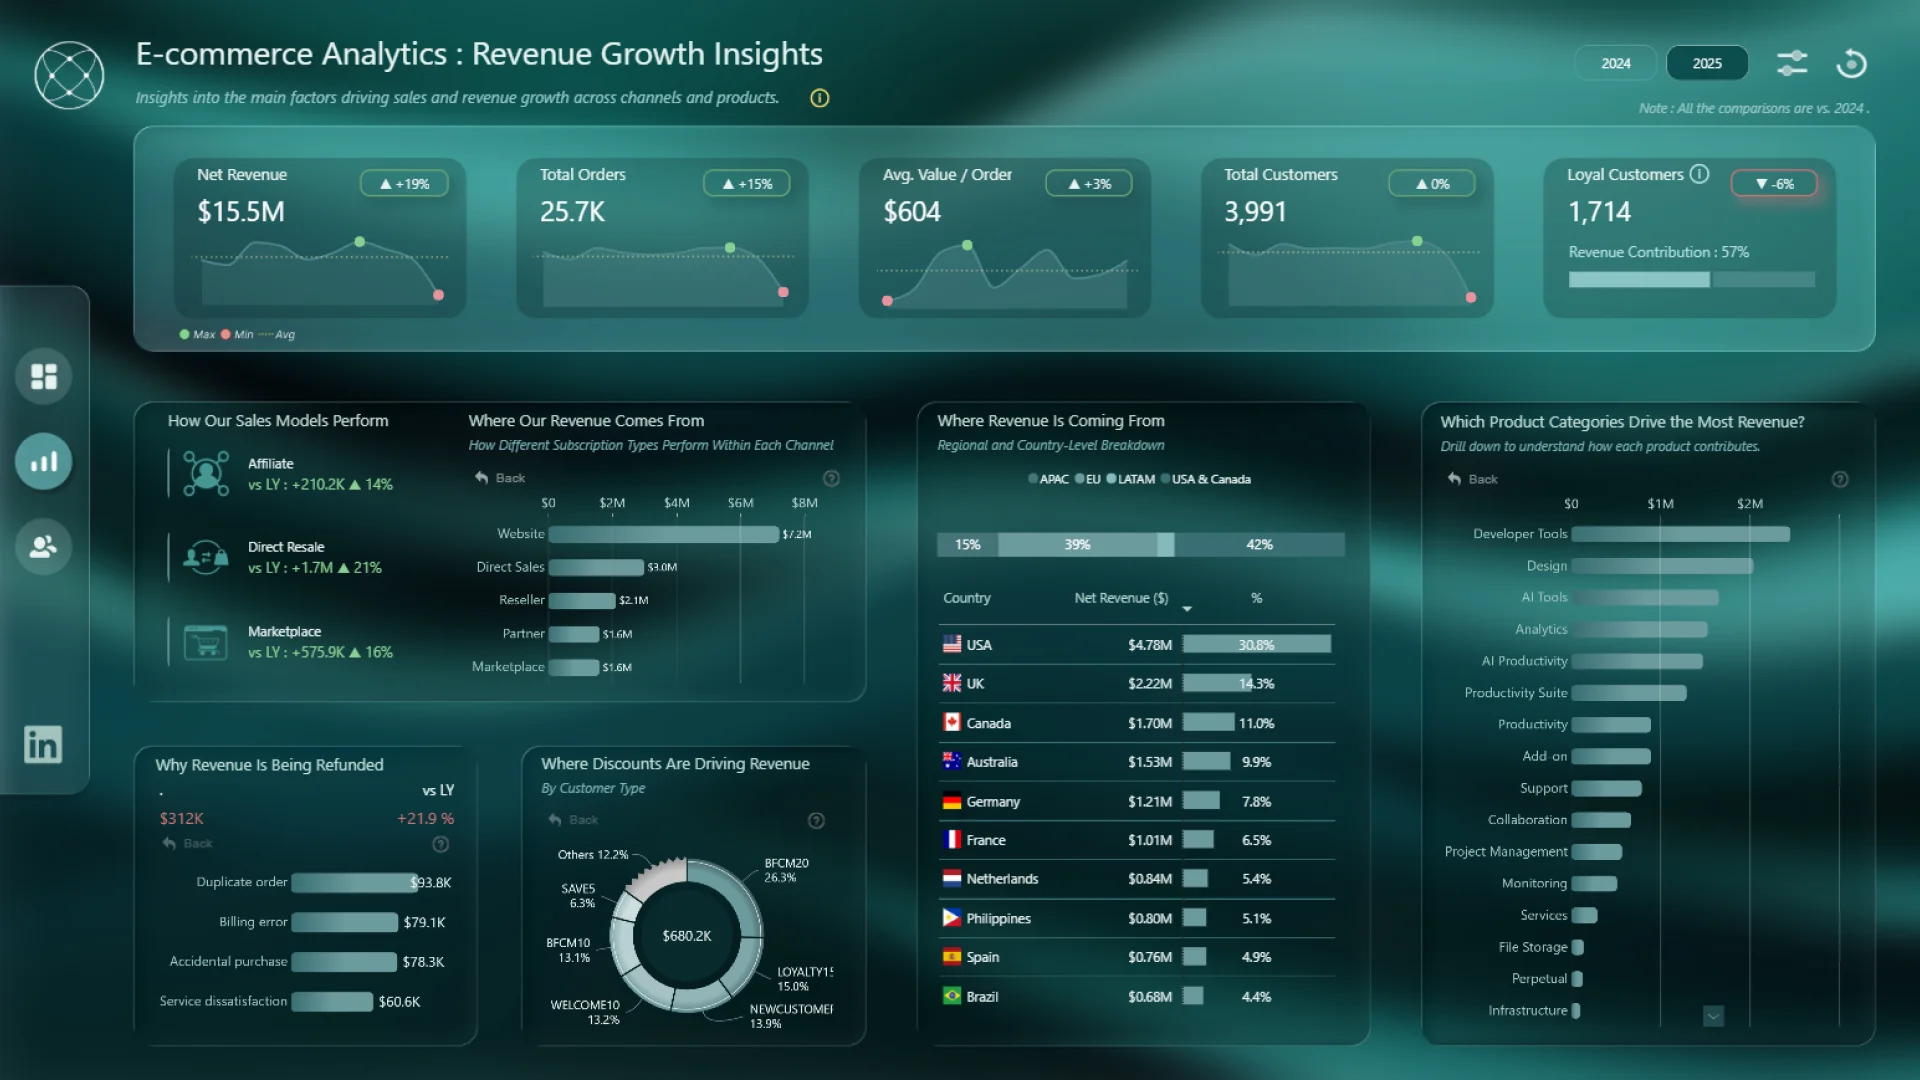
This Power BI report uses the e-commerce sales dataset from a global software retailer that sells subscriptions and add-ons across analytics, design, collaboration, and AI. The report features ZoomCharts Drill Down PRO custom visuals for Power BI. It was submitted to the Onyx Data DataDNA ZoomCharts Mini Challenge in October 2025.
Author description:
A Power BI dashboard built on Onyx Data’s Ecommerce Analytics dataset, featuring three pages: Executive Overview, Revenue Growth Insights (highlighting revenue drivers), and Customer Insights (analyzing loyal customers and their contribution). The report uses an iOS-style glass UI designed in Figma for a clean, modern look.
Mobile view allows you to interact with the report. To Download the template please switch to desktop view.