Feel free to leave your vote:
0
Share template with others
Summary
This Power BI report uses the Athlete Health and Injury dataset and features ZoomCharts Drill Down PRO custom visuals for Power BI. It was submitted to the FP20 Analytics ZoomCharts Data Challenge in August 2025.
Author's Description:
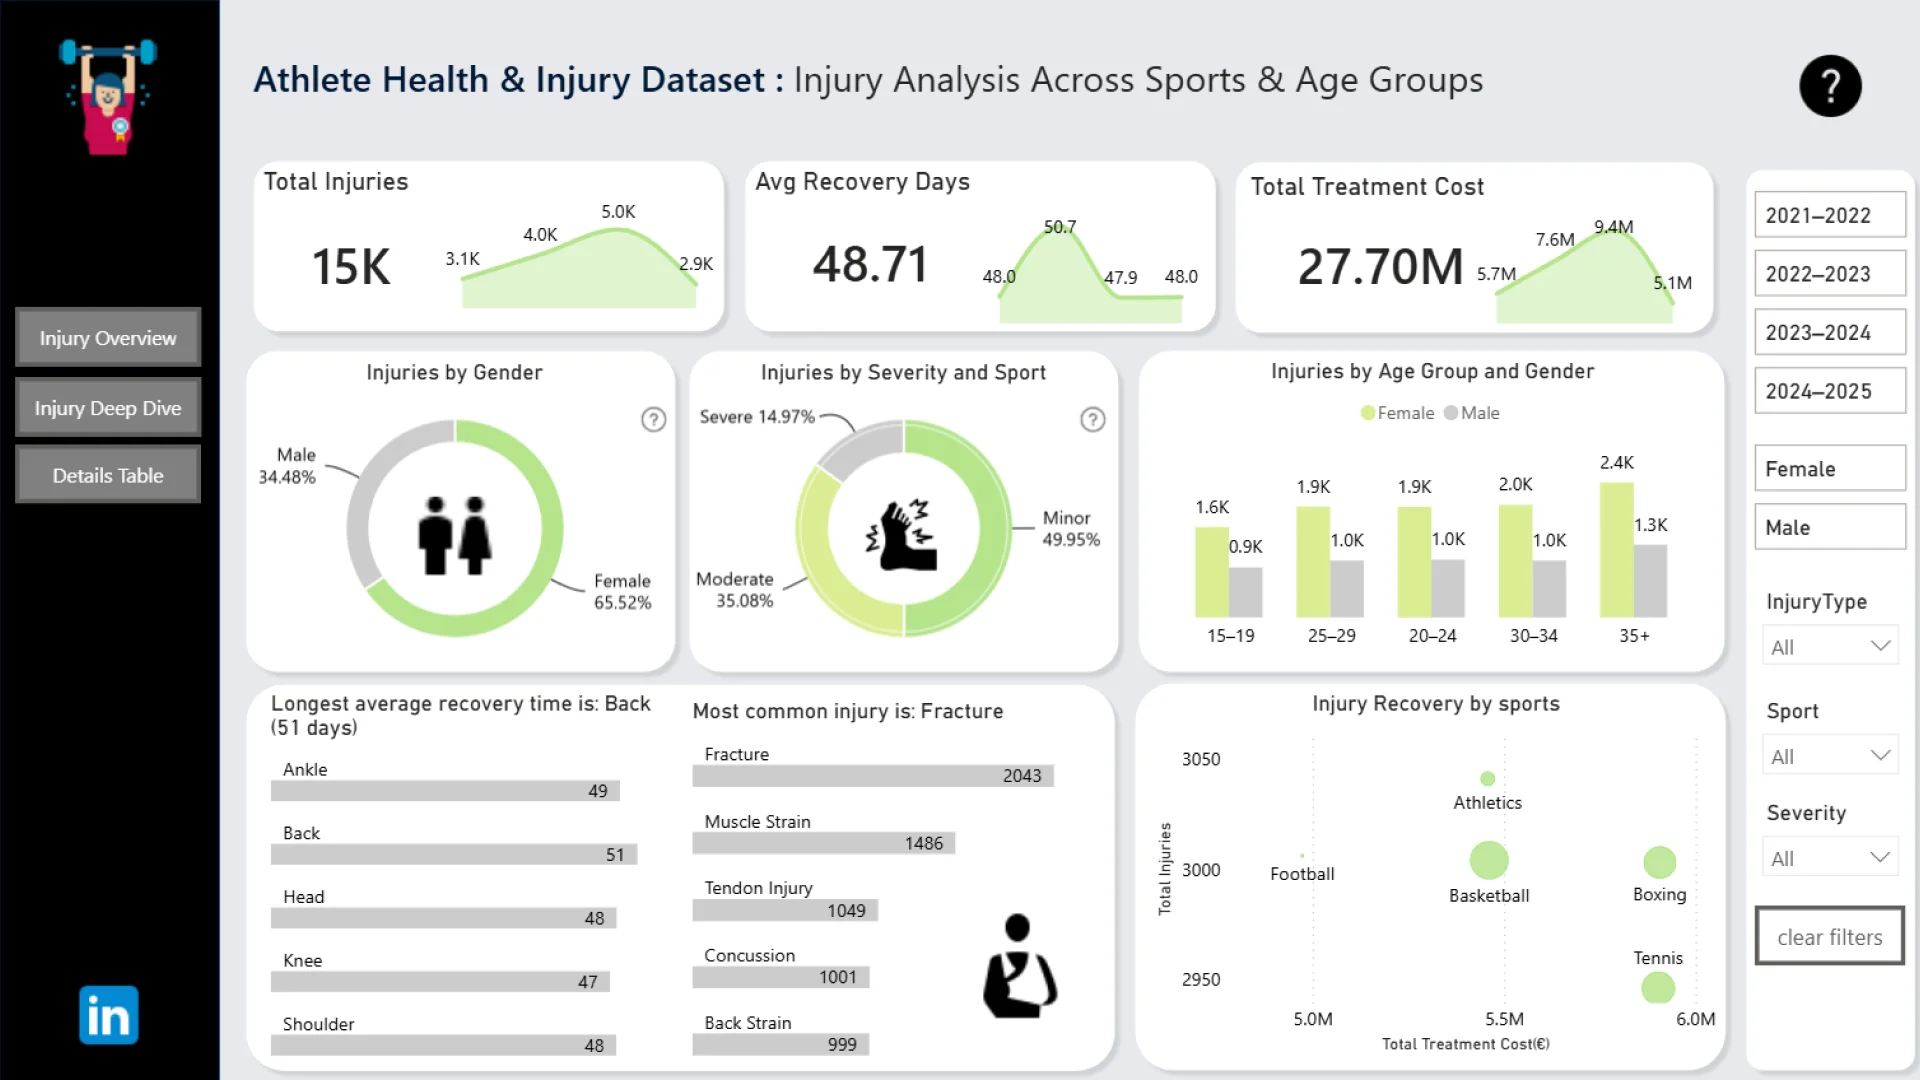
This Power BI report analyzes sports injury data to uncover critical insights on injury frequency, severity, treatment costs, and recovery time. With interactive visuals and dynamic filtering using ZoomCharts, it highlights patterns across gender, location, competition levels, and injury types. The report empowers stakeholders to make data-driven decisions to reduce injury risk and improve athlete care.
Mobile view allows you to interact with the report. To Download the template please switch to desktop view.