Feel free to leave your vote:
0
Share template with others
Summary
Report submitted for Onyx Data DataDNA ZoomCharts Mini Challenge, January 2025. The report is based on the Merchandise Sales dataset and includes ZoomCharts custom Drill Down PRO visuals for Power BI.
Author's description:
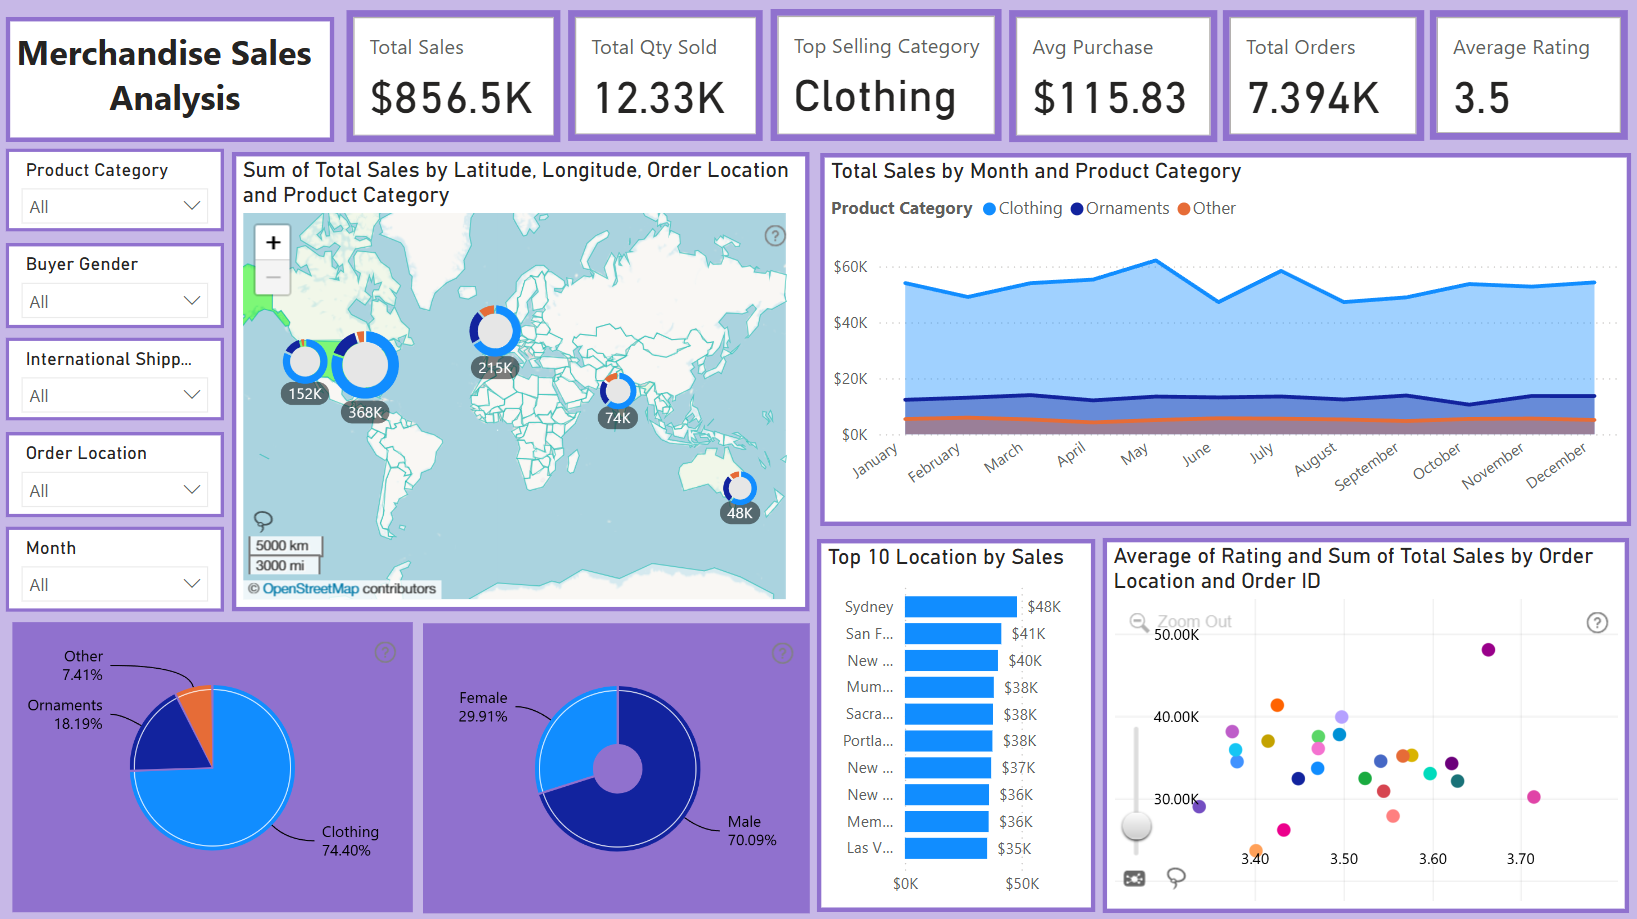
This Power BI dashboard presents a Merchandise Sales Analysis using the Onyx Data - DataDNA Dataset Challenge - January 2025. The report provides insights into total sales, product category trends, top-selling locations, and buyer demographics.
Key Features:
✔ Total Sales Overview – KPIs for total sales, quantity sold, average purchase value, and rating.
✔ Sales Trends – Monthly sales trends segmented by product category.
✔ Top Locations – Sales distribution across the top 10 cities.
✔ Geographical Insights – A world map showing sales distribution by location and category.
✔ Buyer Demographics – Sales breakdown by gender and product category.
✔ Ratings vs. Sales – A scatter plot analyzing customer ratings and total sales.
This dashboard utilizes ZoomCharts for interactive visuals, enabling dynamic data exploration. It aims to provide actionable insights for better sales strategies.
Mobile view allows you to interact with the report. To Download the template please switch to desktop view.