Feel free to leave your vote:
5
Share template with others
Summary
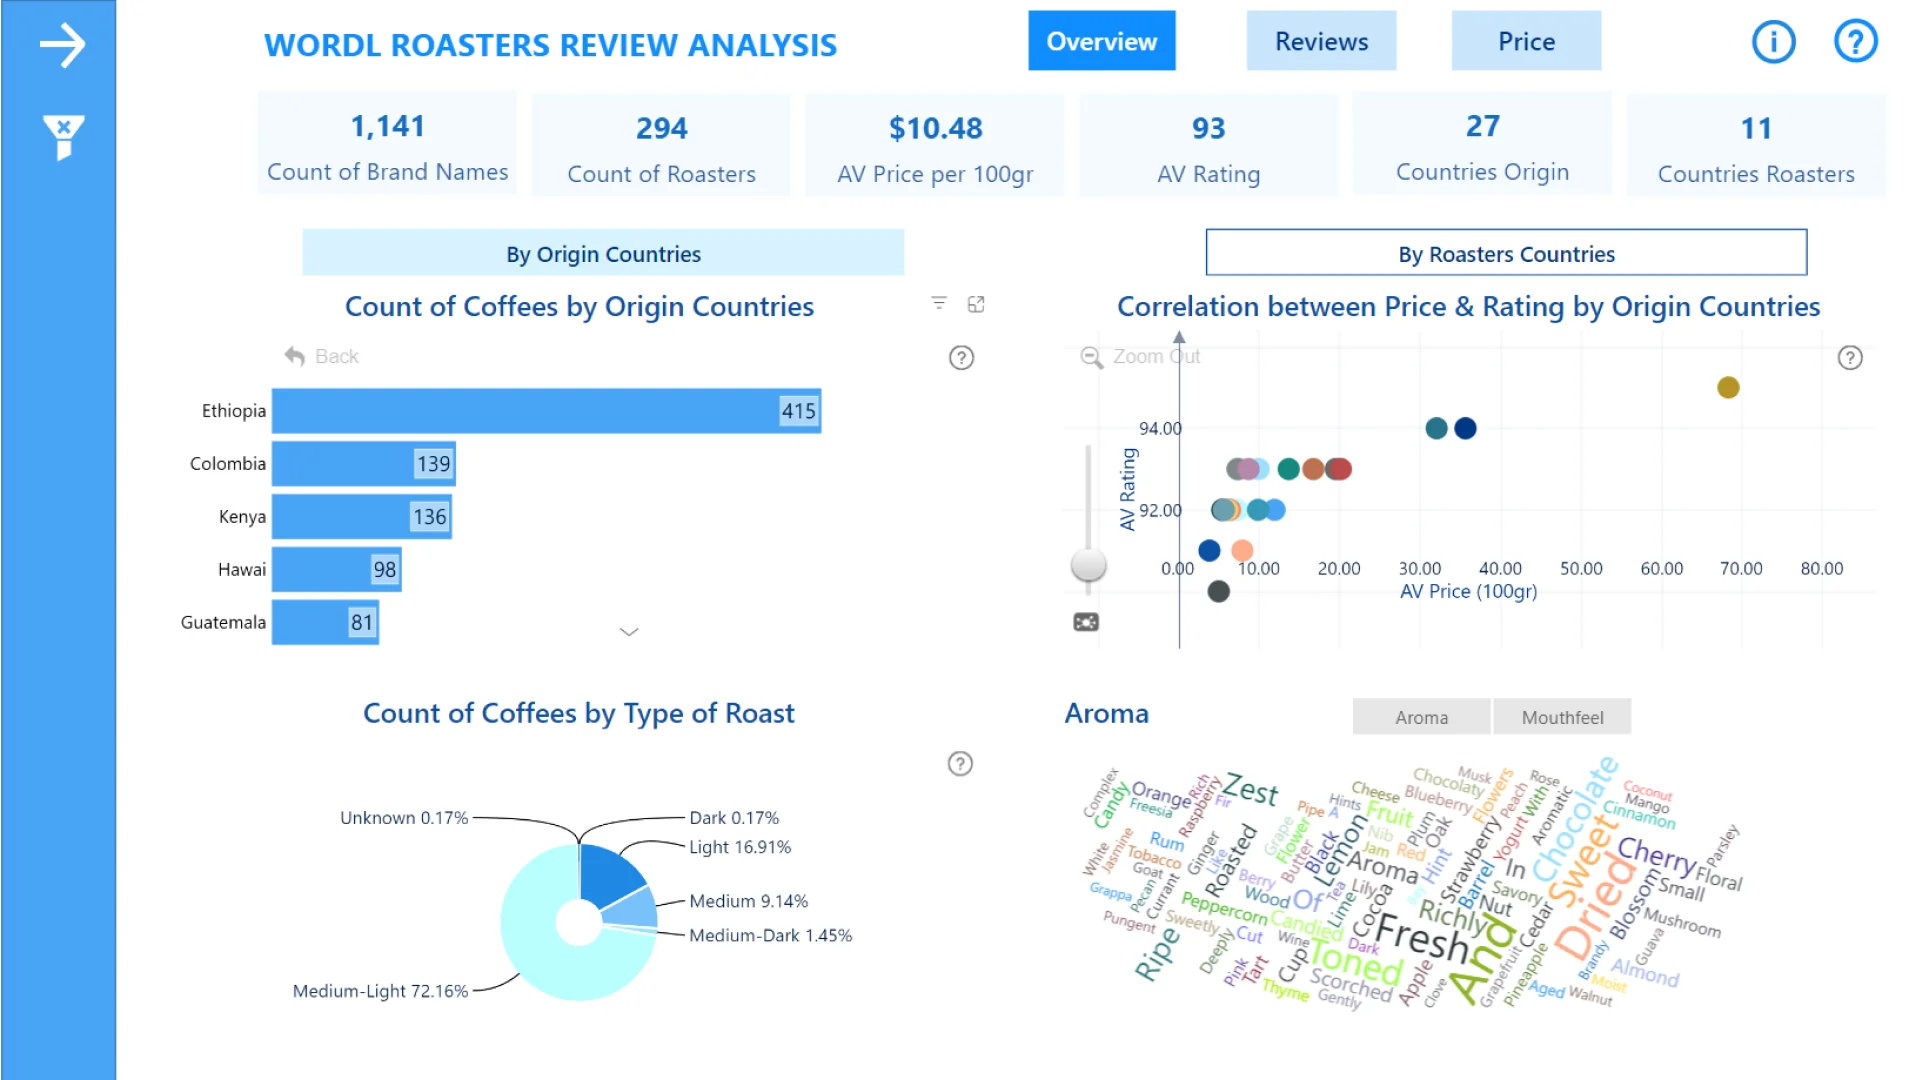
Report submitted for FP20 Analytics ZoomCharts Challenge 16 (May 2024). The report was built with the Coffee Roaster Dataset and includes ZoomCharts custom Drill Down PRO visuals for Power BI.
Author's description:
This Power BI dashboard analyzes coffee brand reviews, highlighting average ratings, prices, total reviews, trends by roast type, brand, and origin, as well as the geographical distribution of roasters and origins.
Mobile view allows you to interact with the report. To Download the template please switch to desktop view.
