Feel free to leave your vote:
0
Share template with others
Summary
This Power BI report uses the Athlete Health and Injury dataset and features ZoomCharts Drill Down PRO custom visuals for Power BI. It was submitted to the FP20 Analytics ZoomCharts Data Challenge in August 2025.
Author's Description:
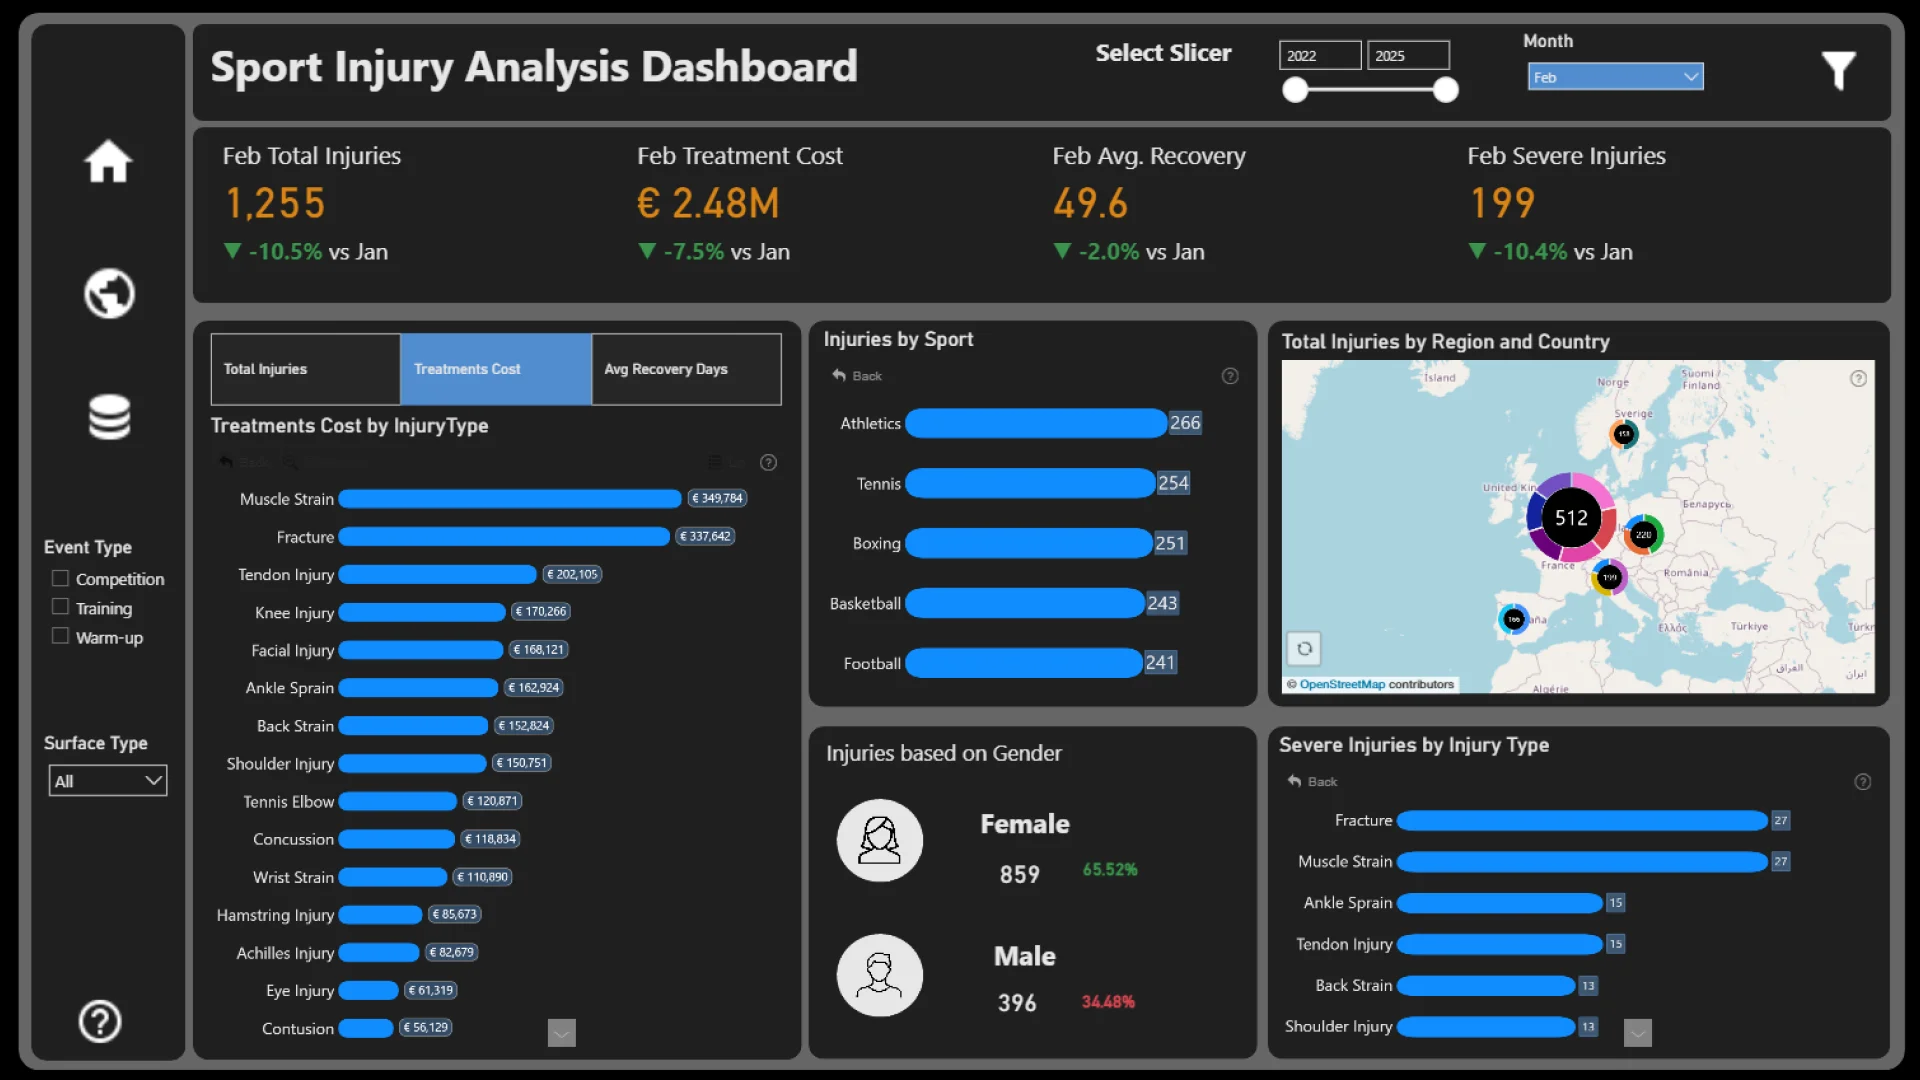
The Sports Injury Analysis Dashboard provides a comprehensive overview of injury patterns among athletes, helping sports organisations, coaches, and medical teams make data-driven decisions. It tracks total injuries, recurrent injury rates, and most common injury types, while breaking down data by injury Locations, and time trends.
ZoomCharts visuals used
Mobile view allows you to interact with the report. To Download the template please switch to desktop view.