Feel free to leave your vote:
2
Share template with others
Summary
Report submitted for Onyx Data DataDNA ZoomCharts Mini Challenge, May 2024. The report was built based on Tech Support Analysis dataset and includes ZoomCharts custom Drill Down PRO visuals for Power BI.
Author's description:
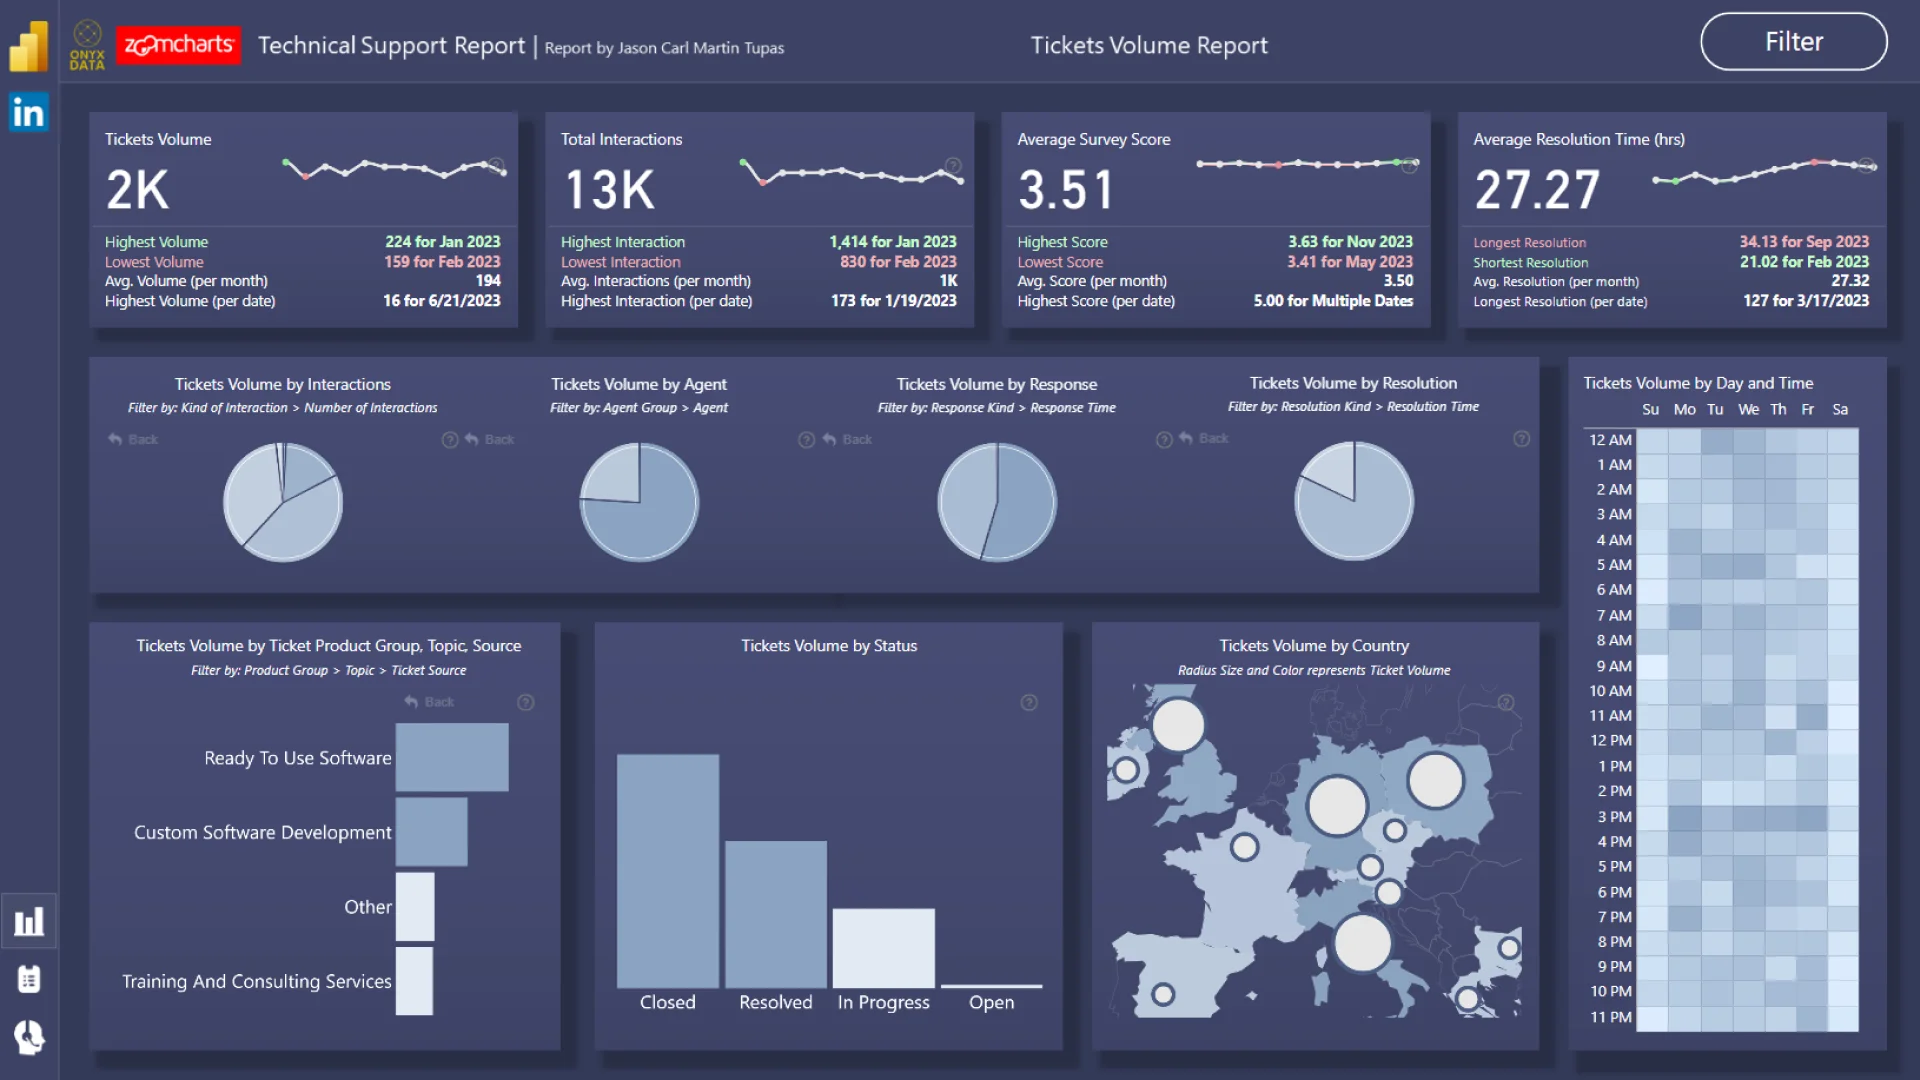
Structure of the Power BI Report:
Tickets Volume Report: Comprehensive analysis of monthly and daily ticket numbers, spotlighting peaks and troughs.
Customer Satisfaction Report: Offers an overview of satisfaction scores and focused into different factors that may affect the customer's feedback.
Agents Performance Report: I assess each agent's performance based on criteria such as initial response time, priority, and compliance with SLAs.
Each page within this report includes a special "Filter" button to toggle additional slicers, enhancing data analysis capabilities!
Key Insights:
Ticket Volume: January recorded the highest volume with 187 tickets, while February saw the lowest at 123. The busiest day was November 30, with 13 tickets received.
Resolution Time: February boasted the shortest average resolution time at 21 hours. Typically, tickets take over a day to resolve.
Customer Satisfaction: Interestingly, customer satisfaction doesn't seem significantly affected by initial response time or other measured factors.
Response Times: Emails generally take longer than 10 minutes to respond to, whereas chat and phone tickets are addressed in under 10 minutes by all agents.
ZoomCharts visuals used
Mobile view allows you to interact with the report. To Download the template please switch to desktop view.