Feel free to leave your vote:
7
Share template with others
Summary
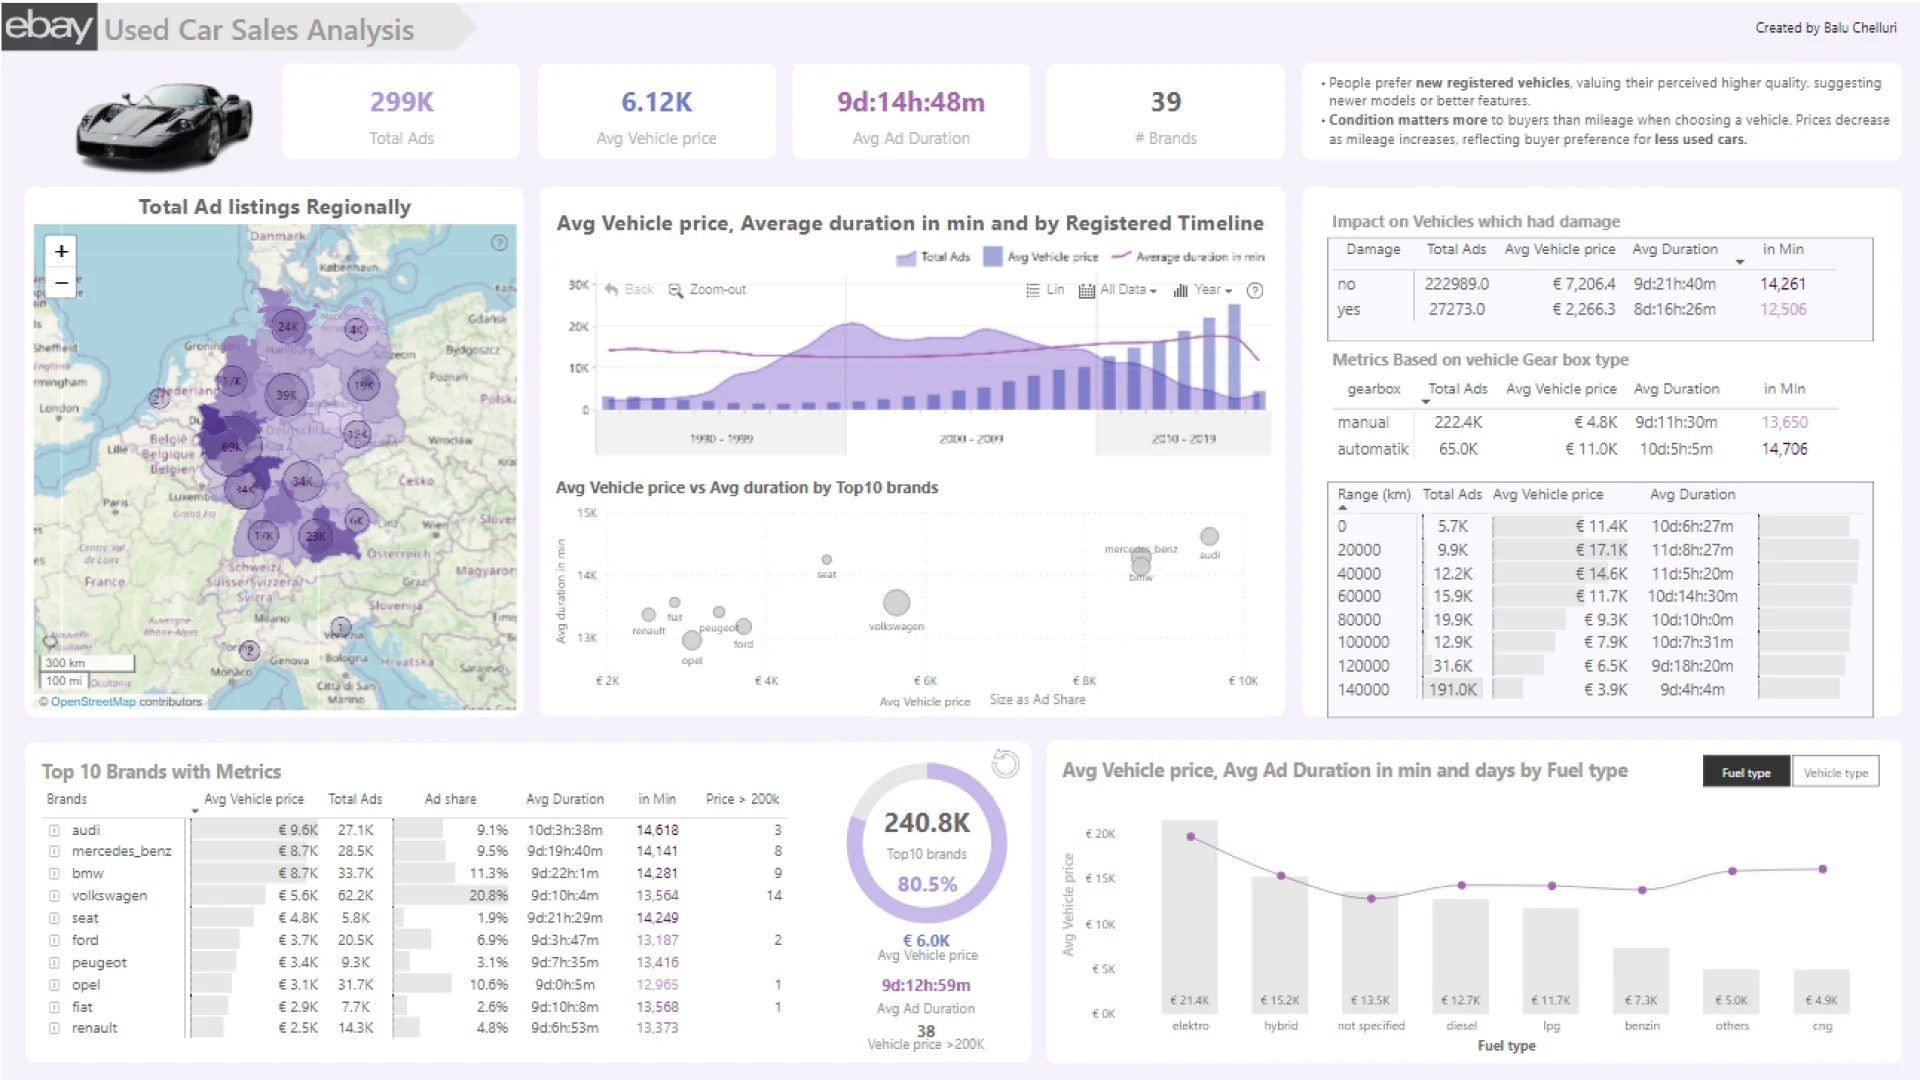
Report submitted for Onyx Data DataDNA ZoomCharts Mini Challenge, March 2024. The report was built based on eBay Used Car Sales Analysis dataset and includes ZoomCharts custom Drill Down PRO visuals for Power BI.
Author's description:
For this project, I envision myself as a Data Analyst working at an analytical firm called 'Onyx Data Solutions,' partnered with eBay. The Regional Sales Manager of Germany wants to understand the purchasing behavior of used cars and their buyers, and I'm here to assist them.
Understanding the Data and Setting Boundaries (For the Technical Staff at eBay): The data was scraped from the eBay website for two months (March 2016, April 2016) by the team at Onyx. The initial number of ads/listings is around 371k. This includes a wide range of vehicles, from budget-friendly options to luxury cars. The maximum price in the listings is approximately 2.15 billion, indicating the presence of extremely high-end vehicles. Within this dataset, only 411 vehicles are priced over 100k (0.1%), while 70 entries are priced above 1 million. This highlights the diversity in pricing within the listings, with the majority falling below the 100k mark (99.9%). However, it's important to note that there may be genuine high-end vehicles priced above this threshold. Notably, luxury brands like Porsche, Ferrari, Lamborghini, and Maserati account for only around 60 ads with an average price of 363k. This concentration of luxury vehicles could skew our analysis if not properly accounted for. To mitigate this, I've decided to increase the price limit from 100k to 200k, reducing the listings from 411 to 173. Additionally, there are some entries with zero prices. Sometimes users post these as a sign for open-to-bargain deals, so I haven't considered these listings for pricing analysis. In addition to considering price, I've also limited our analysis by registration year. Only entries from 1990 to the date of crawling are being considered. This helps ensure that we're focusing on vehicles that are relevant and current. Some entries had random registration years (e.g., 999, 2099), which were excluded from our analysis during data cleaning. After conducting data cleaning and applying the aforementioned limits, the resultant listings are around 299k (80.5%).
My analysis focuses on four key metrics:
Average Ad Price: This metric aims to determine the average listing price of the vehicles in the dataset.
Average Ad Duration: This metric measures the average time it takes for a listing/ad to be sold or removed by the user. It provides insights into the velocity of vehicle sales.
Total Ads: This metric represents the total number of advertisements or listings in the dataset. It provides an overview of the volume of vehicle listings available for analysis.
Ads Share: This metric quantifies the share of ads for each brand and model of vehicles. It helps identify the distribution of advertisements across different brands and models within the dataset.
My aim is to gain insights into the trends and patterns within the dataset by examining these metrics.
Mobile view allows you to interact with the report. To Download the template please switch to desktop view.
