Feel free to leave your vote:
2
Share template with others
Summary
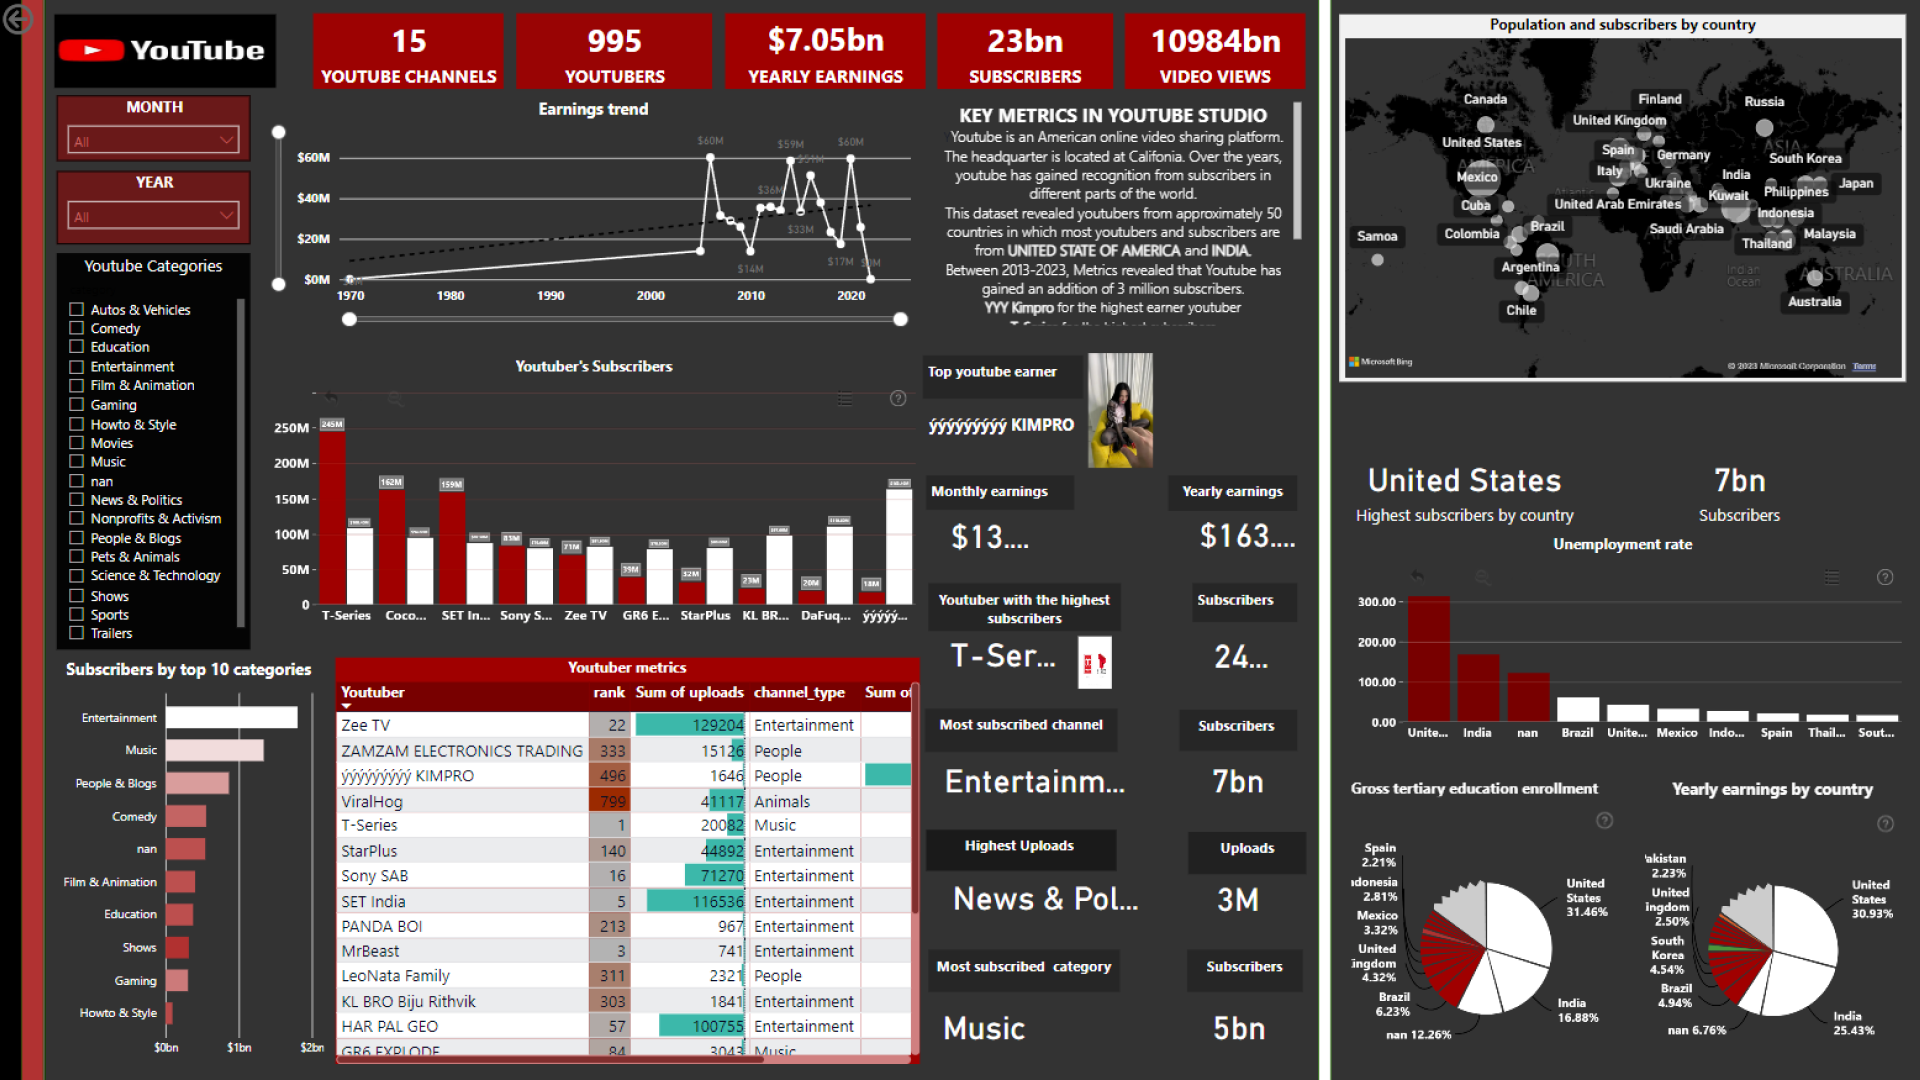
Report submitted for Onyx Data DataDNA ZoomCharts Mini Challenge, November 2023. The report was built based on Top YouTubers dataset and includes ZoomCharts custom Drill Down PRO visuals for Power BI.
Author's description:
This project is divided into 2 spaces; one part showcases yearly performance on earnings, rate, subscribers and video views. The second part is a geospatial analysis of subscribers, population and education level from different countries.
The report used drilldown interactions. It combines categories into one chart to help users drill up and drill down. The report showcase insights with 4 ZoomCharts visuals (Drill Down Pie PRO and Combo PRO) and it supports navigation of YouTuber's earnings and subscribers. The geographical analysis report was visualized on a map; revealing different countries, population and subscribers. The report used tooltips to provide more insights on the report as users can easily explore the dashboard. The report intentionally ignored to edit interactions. It is more of a filter context analysis and users can interact with the dashboard with just a click to view any specific data.
Mobile view allows you to interact with the report. To Download the template please switch to desktop view.
