Feel free to leave your vote:
0
Share template with others
Summary
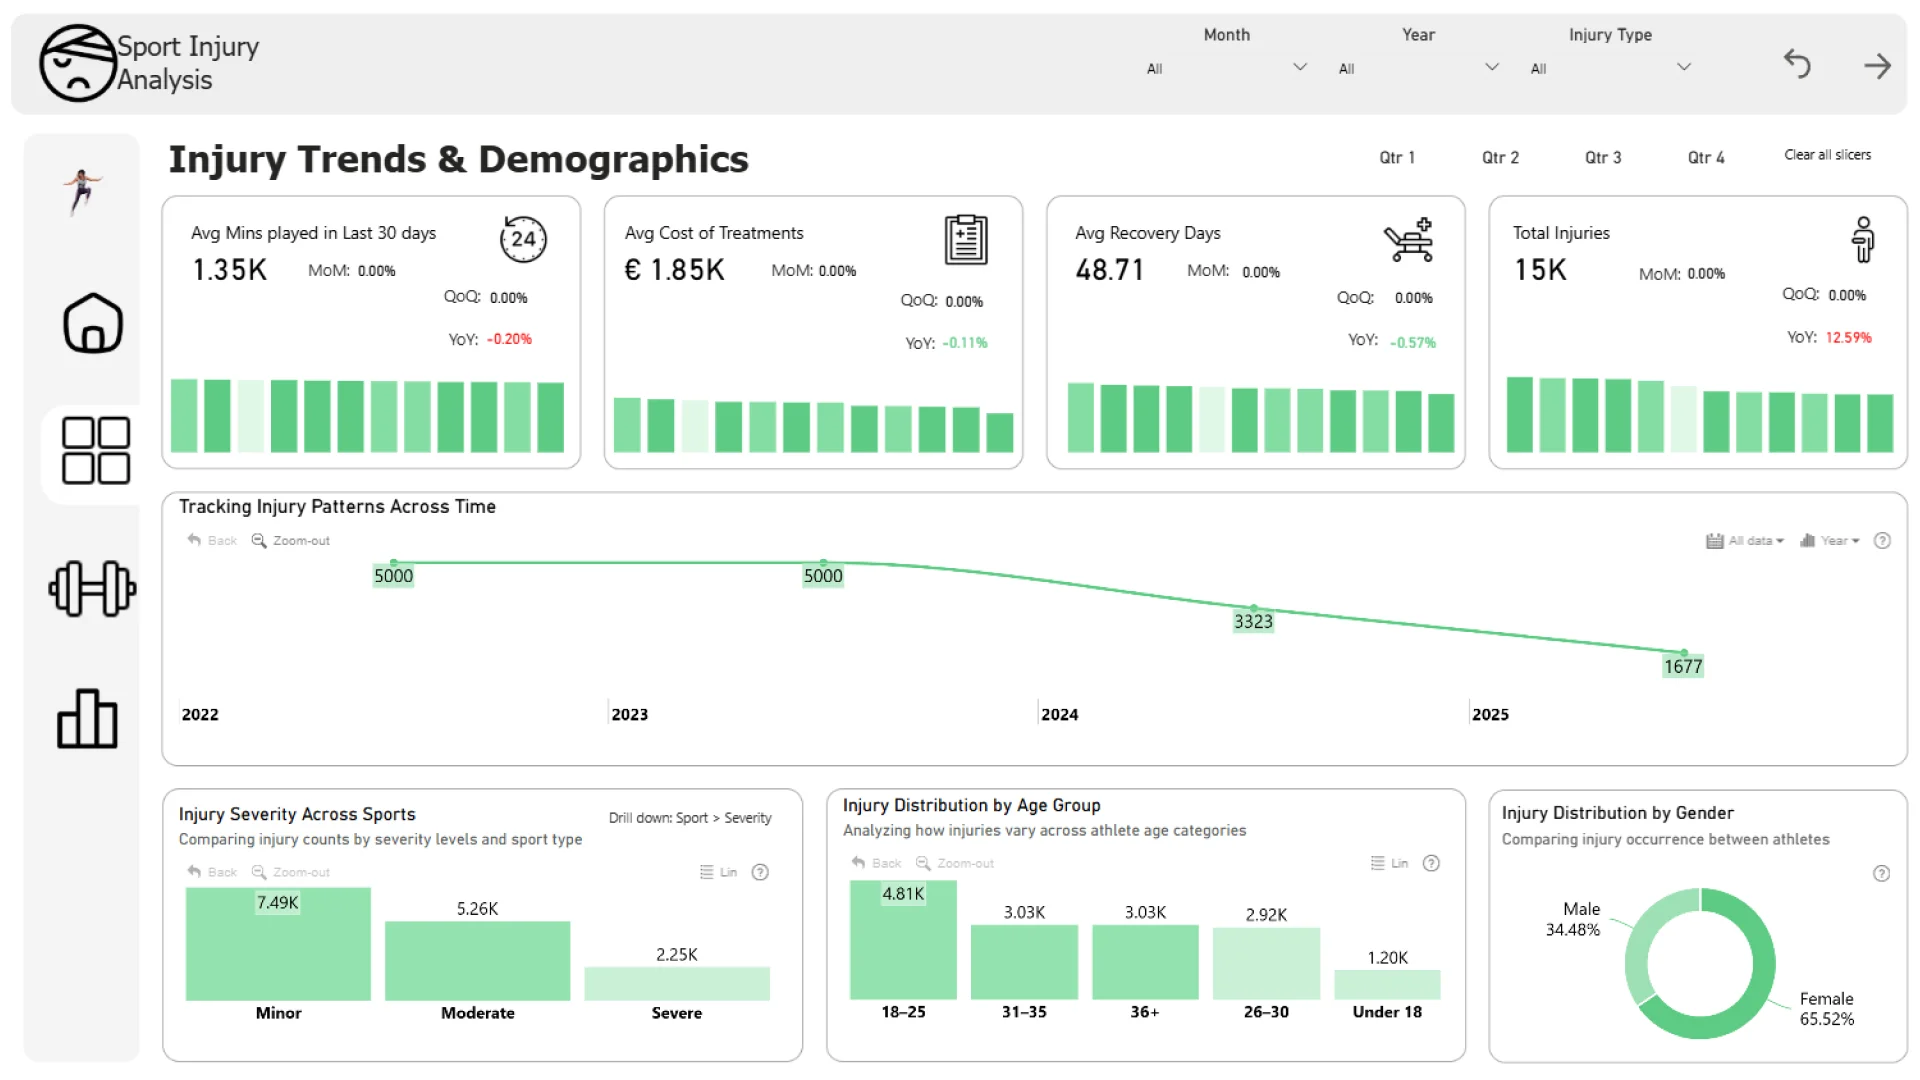
This Power BI report uses the Athlete Health and Injury dataset and features ZoomCharts Drill Down PRO custom visuals for Power BI. It was submitted to the FP20 Analytics ZoomCharts Data Challenge in August 2025.
Author's Description:
This interactive dashboard provides a comprehensive overview of injury records using ZoomCharts drill-through visuals. It highlights injury patterns across demographics, severity levels, events, and locations. With intuitive drill-down features, users can seamlessly move from high-level summaries to detailed insights, enabling deeper understanding and data-driven decision-making.
Mobile view allows you to interact with the report. To Download the template please switch to desktop view.