Feel free to leave your vote:
0
Share template with others
Summary
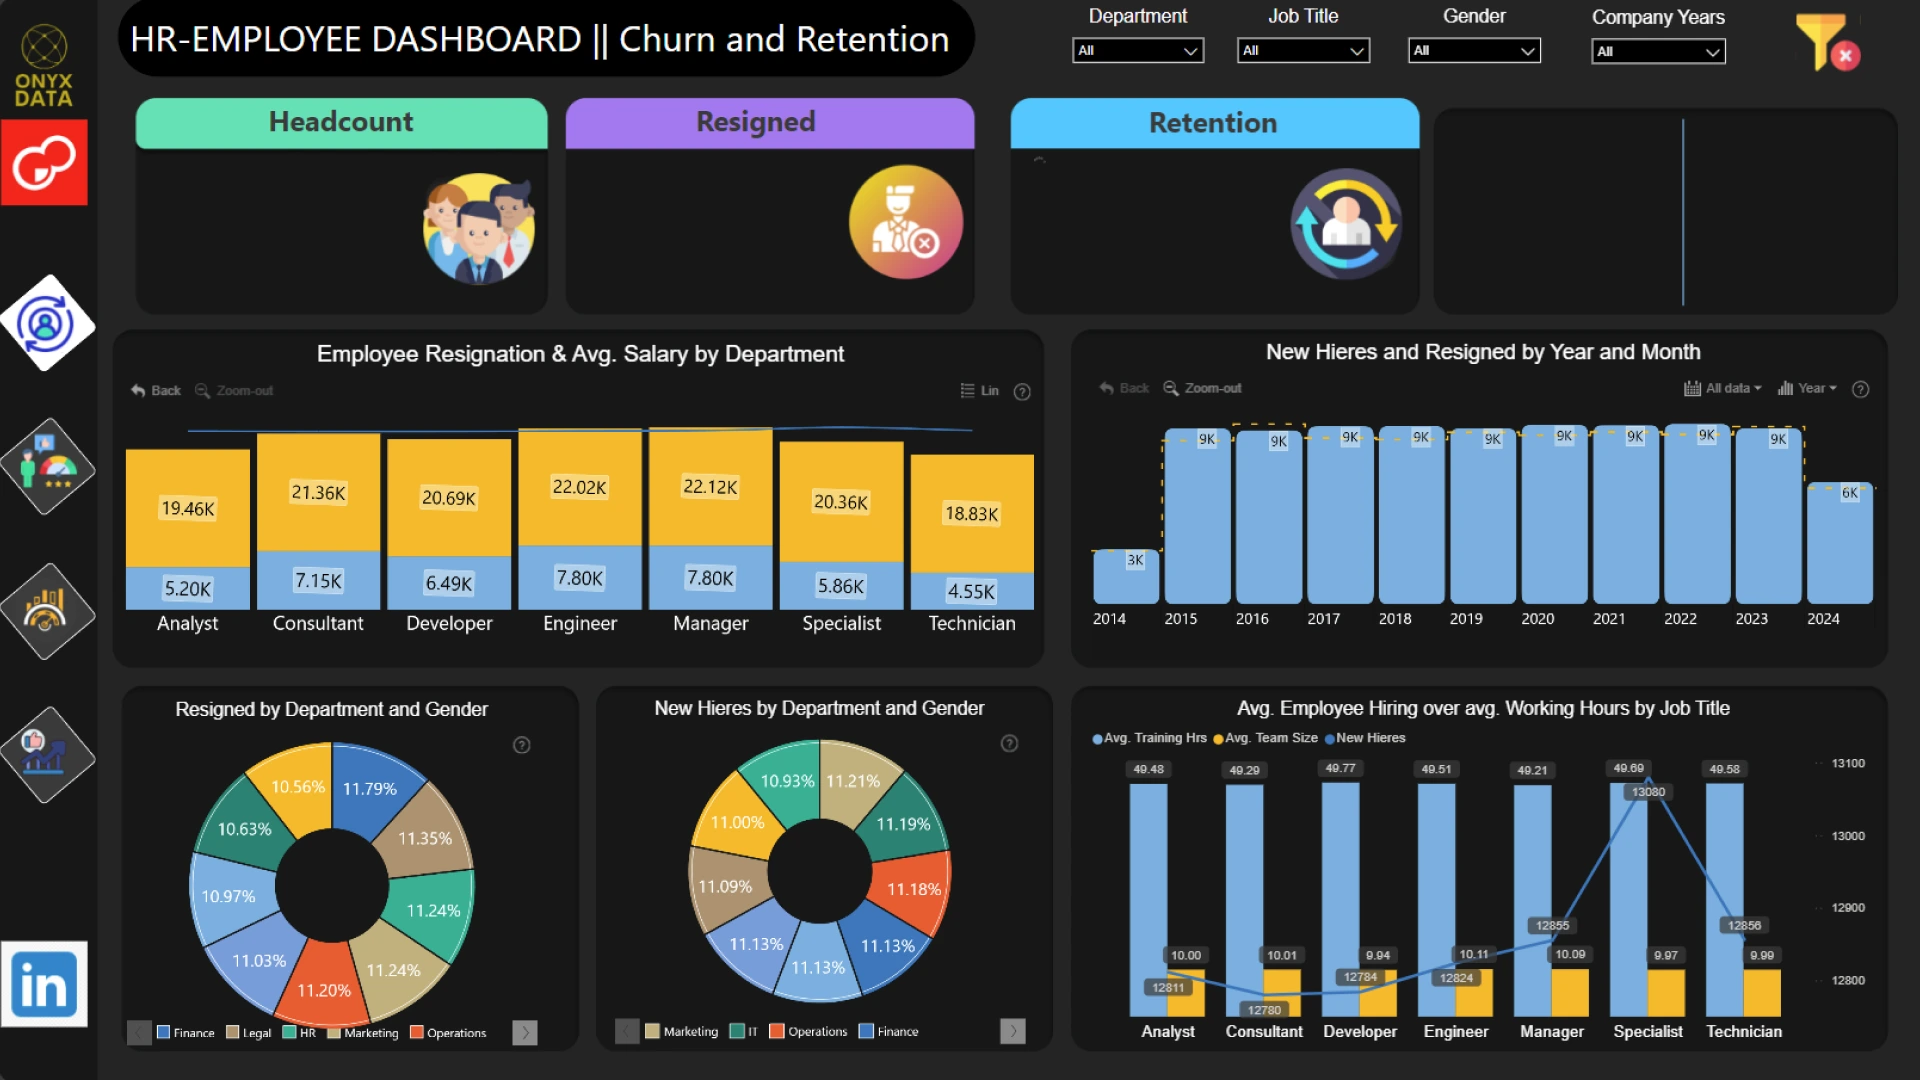
Report submitted for Onyx Data DataDNA ZoomCharts Mini Challenge, October 2024. The report was built based on Employee Performance dataset and includes ZoomCharts custom Drill Down PRO visuals for Power BI.
Author's description:
This Power BI report delves into key aspects of employee performance, productivity, and demographic trends within a corporate setting. With a focus on providing clear and actionable insights for HR and management, this interactive dashboard covers the following key areas:
✅ Performance Evaluation – Visualizing key metrics to help management understand employee contributions.
✅ Productivity Metrics – Highlighting work hours, projects handled, overtime, and efficiency.
✅ Job Satisfaction Trends – Analyzing job satisfaction from various angles, including promotions, training, and work-life balance.
✅ Churn & Retention Prediction – Identifying potential patterns leading to employee turnover. This dashboard supports better decision-making and drives organizational success through data-driven insights.
Mobile view allows you to interact with the report. To Download the template please switch to desktop view.
