Feel free to leave your vote:
63
Share template with others
Summary
Report submitted for Onyx Data DataDNA ZoomCharts Mini Challenge, September 2023. The report was built based on Shark Tank US dataset and includes ZoomCharts custom Drill Down PRO visuals for Power BI.
Author's description:
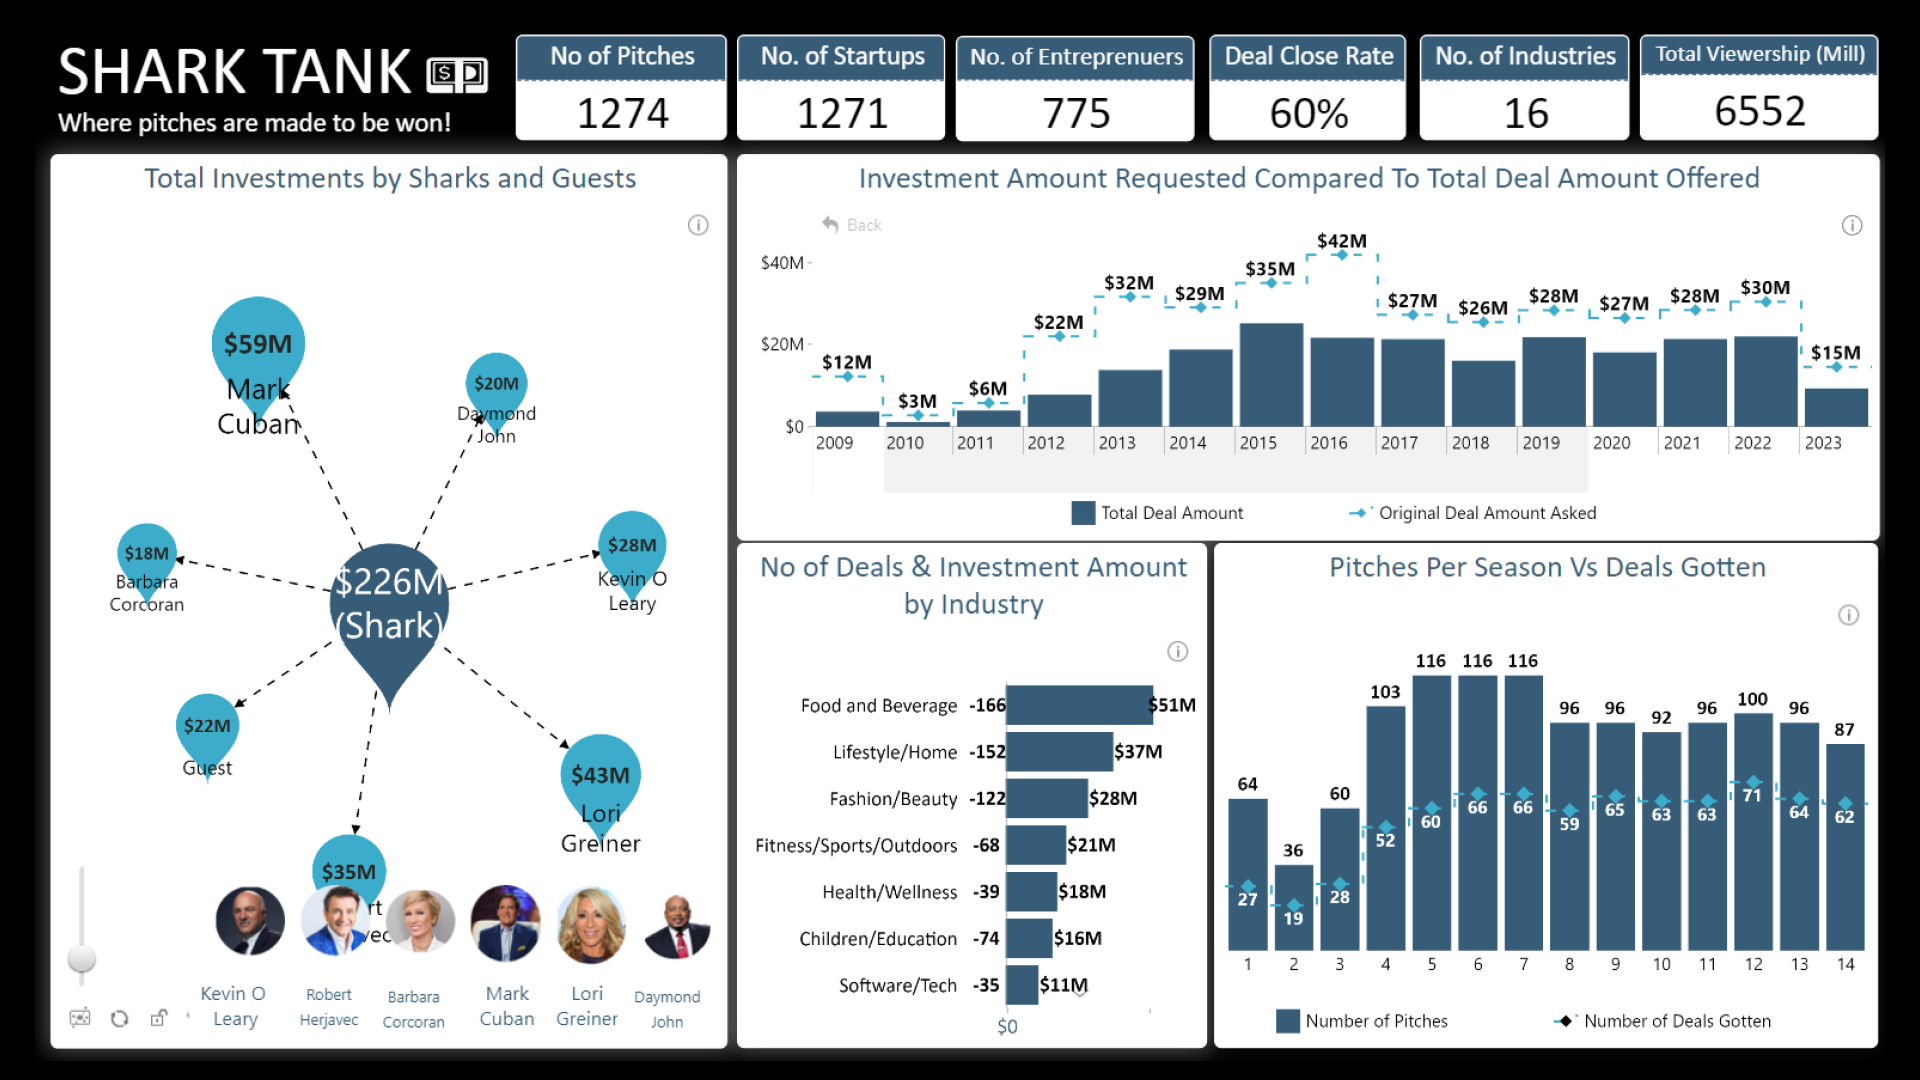
The report is a one page summary which focuses on the pitches that startups/entrepreneurs make in Shark Tank. The card visuals capture the overview of the number of pitches, no of start ups, number of enterprenuer, total viewship of the show in the US and the deal close rate. A drill network pro was used to highlight the total amount invested by sharks in the pitches made and how much each shark has invested. The drill down timeline Pro was used to breakdown the trend of how much was asked by the pitchers and how much was invested by the sharks. The drill down combo pro was used to highlight how many pitches were made per season and how many successfully closed the deal. The drill down combo bar was used to highlight how much was invested into each industry and the distribution of deals by the industry.
ZoomCharts visuals used
Mobile view allows you to interact with the report. To Download the template please switch to desktop view.