logo
For Power BI
  • Products
    • Drill Down Donut Pro Drill Down Donut PRO
    • Drill Down Pie Pro Drill Down Pie PRO
    • Drill TimeSeries Pro Drill Down TimeSeries PRO
    • Drill Combo Pro Drill Down Combo PRO
    • Drill Map Pro Drill Down Map PRO
    • Drill Scatter Pro Drill Down Scatter PRO
    • Drill Down Network Pro Drill Down Network PRO
    • Drill Down Waterfall Pro Drill Down Waterfall PRO
    • Drill Down Graph Pro Drill Down Graph PRO
    • Drill Down Timeline Pro Drill Down Timeline PRO
    • Drill Down Combo Bar PRO Drill Down Combo Bar PRO

    Video tutorials

    Watch Now

    More than 90 videos on how to enhance Power BI with ZoomCharts

    Learn more
    All visuals
  • Resources

      Resources

    • Documentation
    • Report Examples
    • Blog
    • Webinars
    • Video Tutorials
    • Visuals Gallery

    Support

    • ZoomCharts Assistance
    • Contact Sales
    • Contact Support
    • FAQ

    Challenges

    Challenges

    Improve your report creation skills by participating in free challenges for report creators.

    Learn more
    Start trial
  • Services
    • Power BI Report Development
    • Custom Visual Development
  • Challenges
  • Pricing
Request a quote Start Free Book a Demo Sign in
Get it now
Go back

Contents

Go back

Share

Logo

Welcome to the Onyx Data September 2023 Challenge!

Aug 31 - Sep 29, 2023 | EDT

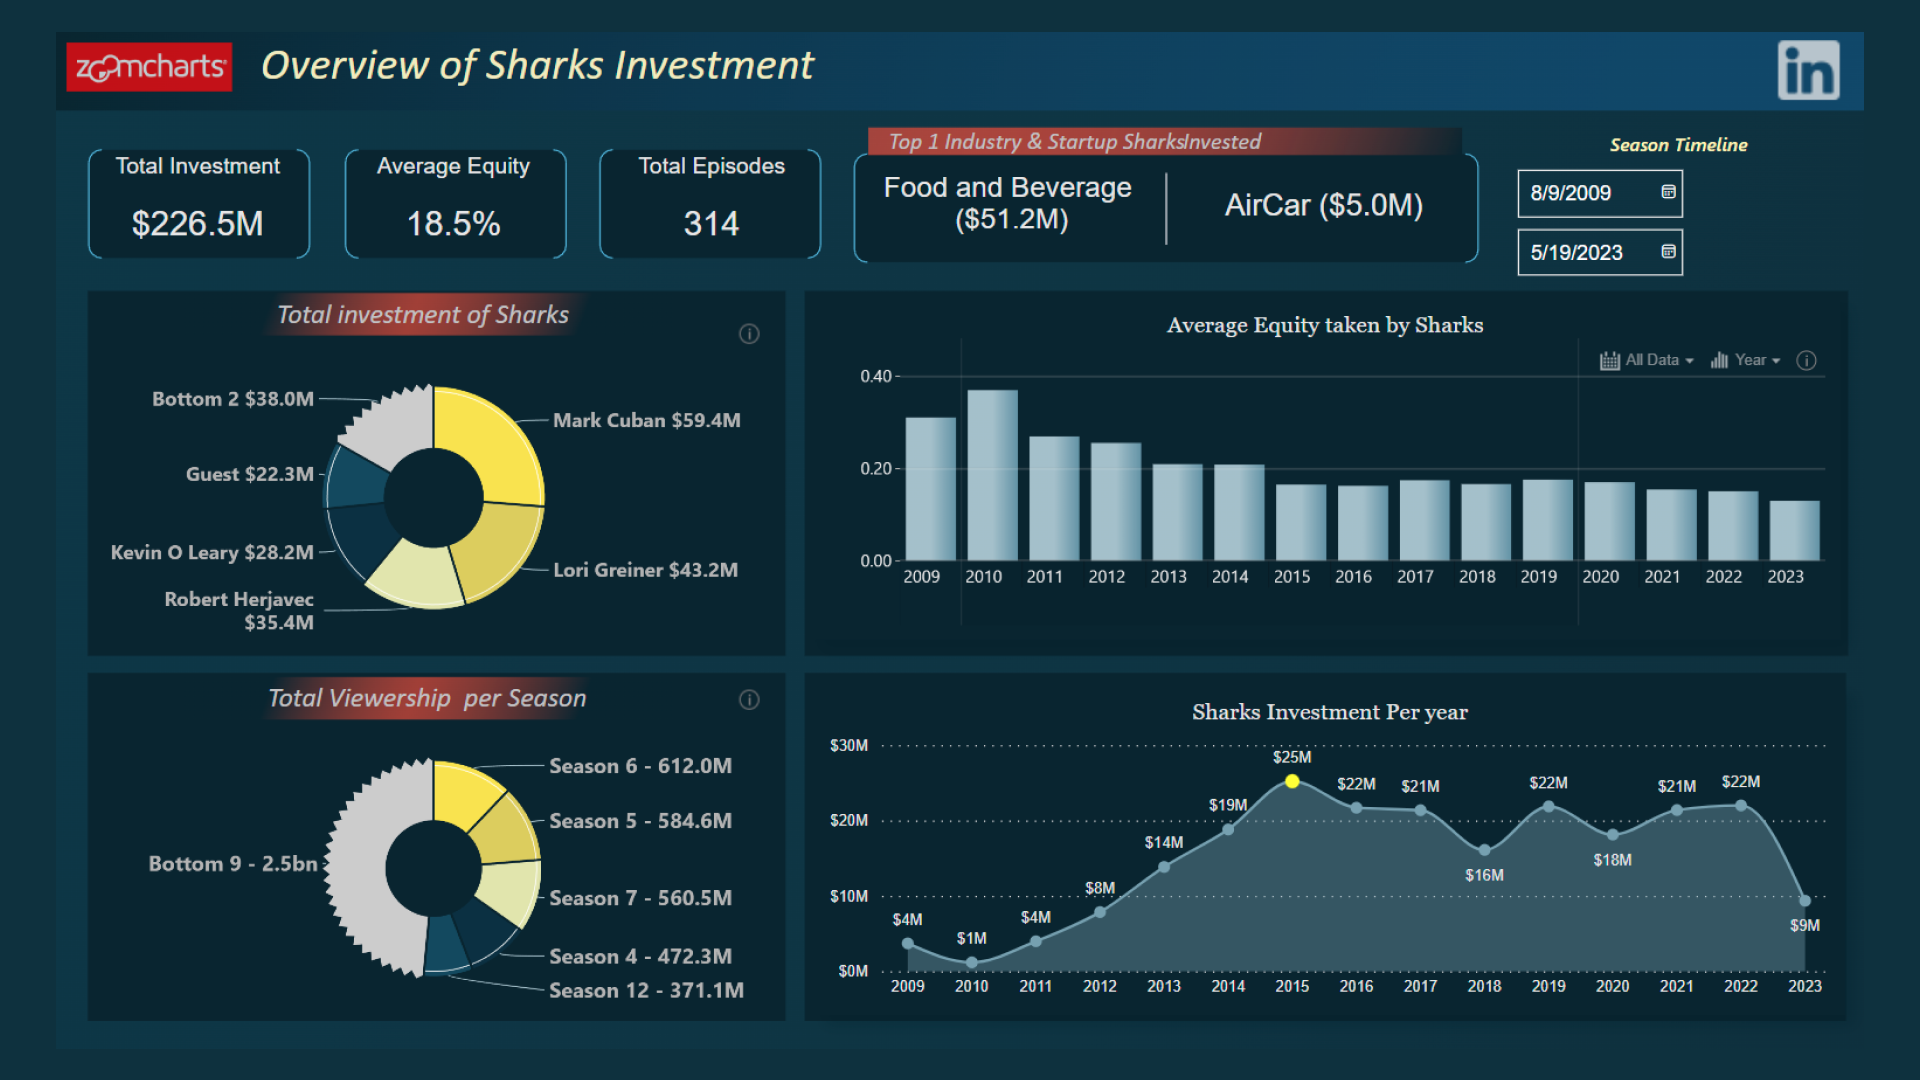
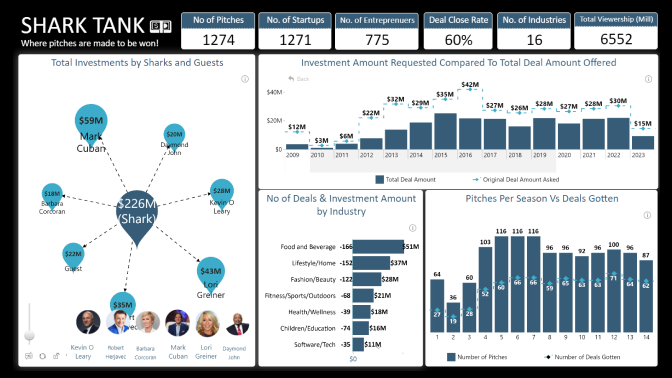
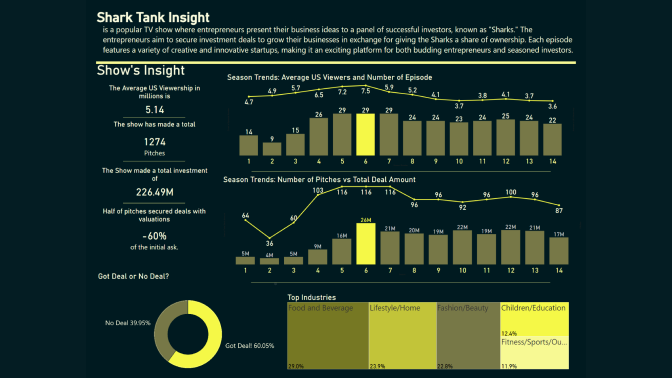
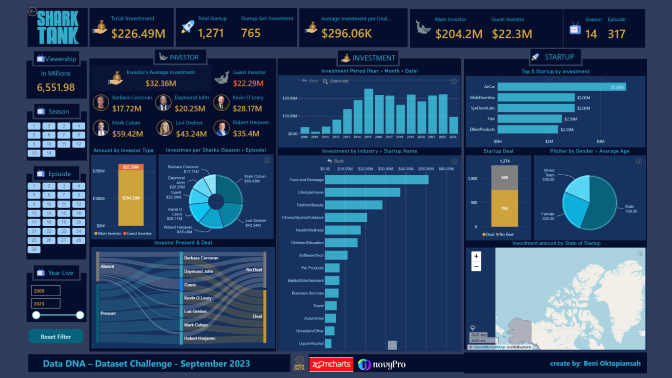
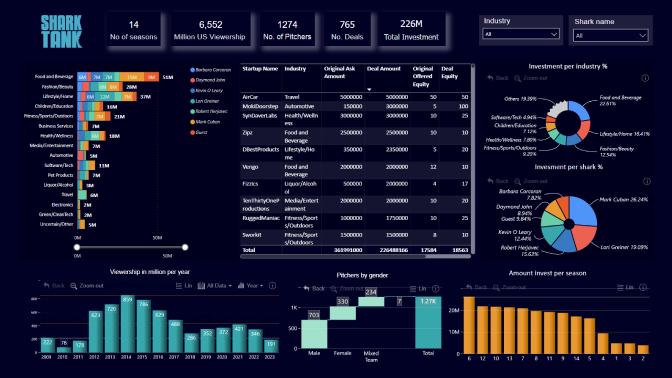
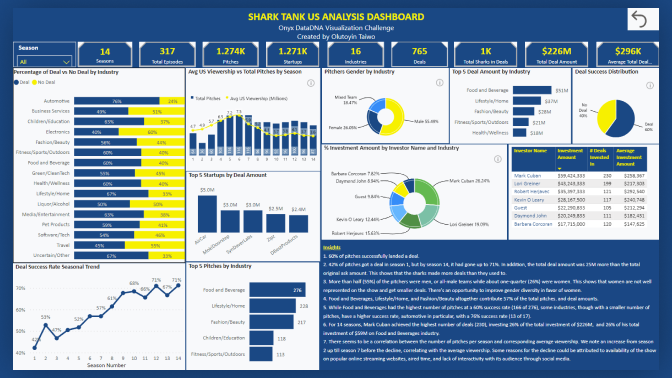
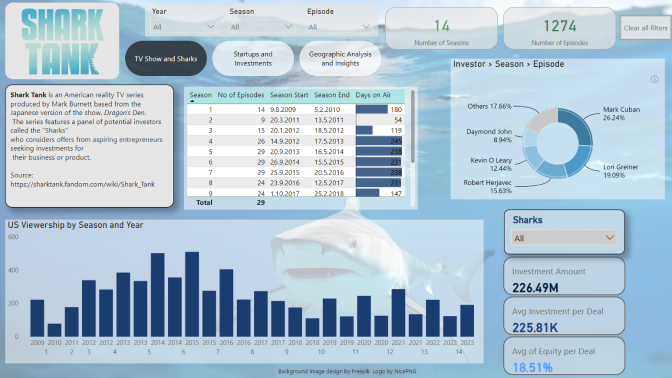
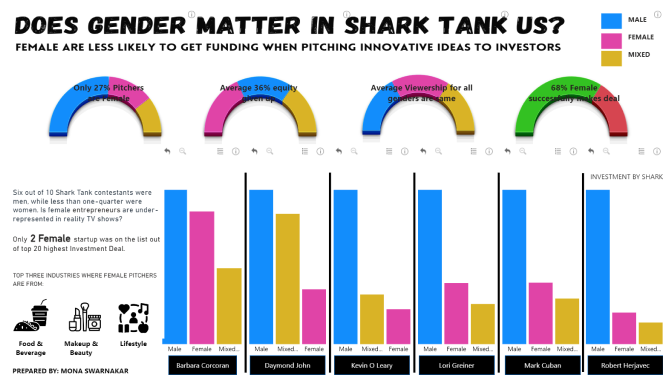
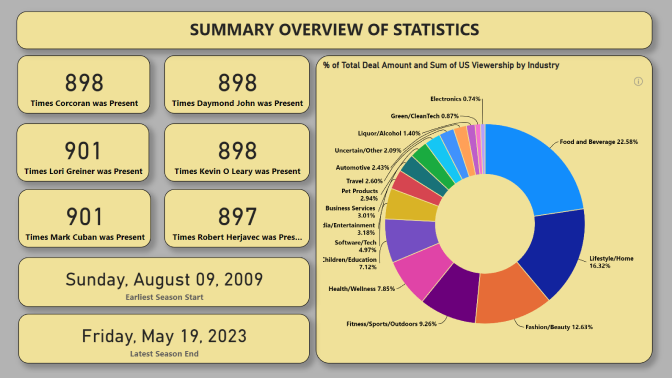
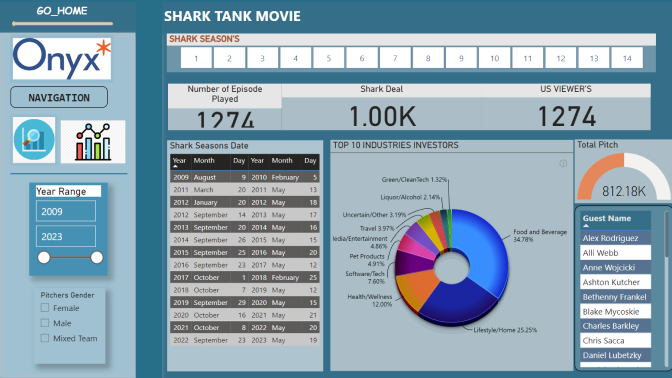
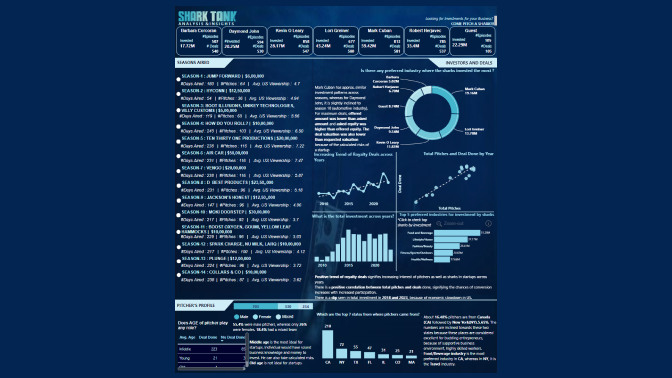
Dive into the waters of the Shark Tank dataset with ZoomCharts Mini Challenge

Timeline

Registration Open

Registration Open

31 August | 21:00

-

Submissions Open

Submissions Open

31 August | 21:00

-

1:1 Mentoring Sessions

1:1 Mentoring Sessions

31 August | 21:00

31 August - 21 September

Entry Submission Deadline

Entry Submission Deadline

21 September | 21:00

31 August - 21 September

Winner Announced

Winner Announced

30 September | 08:00

31 August - 21 September

Dataset

Get the dataset

See past Onyxdata challenges

See past challenges

Share the challenge

Submitted Reports
About challenge
Timeline
Dataset
Past challenges

Winner of the challenge

Report Card

Onyx DataDNA Challenge Shark Tank US

Author: Dharmendar S

121

View Report

All Submissions

Report Card

SharkTankOnyxChallenge_Tsegbemi

Author: Tsegbemi Ayonronmi

63

View Report
Report Card

SharkTankDashInsight

Author: Nathan Paul Bustamante

16

View Report
Report Card

Shark Tank Analysis Report - DataDNA Challenge

Author: Benioktopiansah Oktopiansah

34

View Report
Report Card

Shark Tank by Vanessa Florez

Author: Vanessa Florez

56

View Report
Report Card

Onyx Shark Tank Data Challenge

Author: Toyin Taiwo

13

View Report
Report Card

OnyxData Shark Tank Report

Author: Hajnalka Siflis

16

View Report
Report Card

Shark Tank US

Author: Mona Swarnakar

3

View Report
Report Card

US Shark Tank Data Set

Author: Gori Omotola

1

View Report
Report Card

Shark Tank

Author: Alimi Azeez Adebayo

1

View Report
Report Card

Shark Tank-Analysis and Insights

Author: Sushree Jena

2

View Report

About ZoomCharts Mini Challenge

ZoomCharts Mini Challenge is part of the global DataDNA – Dataset Challenge by Onyx Data, which unites 11K+ data enthusiasts worldwide, ranging from beginners to seasoned professionals, including Microsoft MVPs. Read more about the DataDNA challenge on the Onyx Data website. Join the community on LinkedIn

Participate in ZoomCharts Mini Challenge to enrich your skill in creating excellent reports that help business users explore data quickly and intuitively.

Free License: All participants receive a free ZoomCharts Developer License that gives access to the full Drill Down PRO visuals library. License will remain active for 1 year after the challenge.

Learn from Experienced Professionals: As part of the challenge, we host live workshops on report building and visualizing the challenge’s dataset in Power BI. Challenge participants can also book an individual consultation with an experienced Power BI mentor to ask questions and get personalized tips.

Prizes

The best report’s creator will receive a $300 Amazon gift card from ZoomCharts.

Timeline

Registration Open

Registration Open

31 August | 21:00

-

Submissions Open

Submissions Open

31 August | 21:00

-

1:1 Mentoring Sessions

1:1 Mentoring Sessions

31 August | 21:00

31 August - 21 September

Entry Submission Deadline

Entry Submission Deadline

21 September | 21:00

31 August - 21 September

Winner Announced

Winner Announced

30 September | 08:00

31 August - 21 September

Dataset

Get the dataset

See past Onyx Data September 2023 challenges

See past challenges

Your Drill Down Visuals Developers License

Use the email and password provided below to log in Power BI Desktop and access an account with a license to use all ZoomCharts Drill Down Visuals.

Upon logging in, you will need to change your password and enable two-factor authentication. If you encounter any problems, feel free to reach out to us via chat.

*This Developer License can be used to create a report for this ZoomCharts Mini Challenge or for your personal training purposes. Commercial use of this license is prohibited.

Upload failed
Attach file
File requirements: 16MB

Any questions? Feel free to use chat!

Are you sure you want to delete the report?

Activate your Drill Down visuals Developer License!

You can use these credential to access ZoomCharts visuals and create your report for this ZoomCharts Mini Challenge, or for your personal training purposes.


logo
[email protected]
+44 204 577 3993
logo

Products

Drill Down Network PRO Drill Down Waterfall PRO Drill Down Graph PRO Drill Down Combo PRO Drill Down Combo Bar PRO Drill Down Donut PRO Drill Down Pie PRO Drill Down TimeSeries PRO Drill Down Timeline PRO Drill Down Map PRO Drill Down Scatter PRO All Visuals

Resources

Report Examples Webinars Blog ZoomCharts Academy Visuals Gallery Documentation Custom Visual Development Subscribe to News

Solutions

Custom Visual Development

Company

Pricing About Us Partners Leave feedback Join PowerGroup EU Funding

Help

ZoomCharts Assistance Contact Sales Contact Support FAQ

Drill Down Network PRO Drill Down Waterfall PRO Drill Down Graph PRO Drill Down Combo PRO Drill Down Combo Bar PRO Drill Down Donut PRO Drill Down Pie PRO Drill Down TimeSeries PRO Drill Down Timeline PRO Drill Down Map PRO Drill Down Scatter PRO All Visuals

Report Examples Webinars Blog ZoomCharts Academy Visuals Gallery Documentation Custom Visual Development Subscribe to News

Custom Visual Development

Pricing About Us Partners Leave feedback Join PowerGroup EU Funding

ZoomCharts Assistance Contact Sales Contact Support FAQ
+44 204 577 3993
[email protected]

Ready to get in touch?

Contact our experts with any question about Power BI and ZoomCharts for Free!

Contact us

© 2025, Data Visualization Software Lab

U.S. Patents No. 11,645,343; 11,921,804

Cookies Policy
Manage cookies
Privacy Policy
Global
EULA
Patent
warning

Error message

success

Success info: Done!

ZoomCharts AI Assistant

We noticed you're using an old OS version.

For the best experience, we recommend upgrading to ensure that all website features display correctly.

Cookie settings

We use necessary cookies for site functionality, as well as statistic, marketing, and preference cookies to enhance your experience. For more information and to manage your preferences, please visit our Cookie policy