Feel free to leave your vote:
5
Share template with others
Summary
Report submitted for Onyx Data DataDNA ZoomCharts Mini Challenge, May 2024. The report was built based on Tech Support Analysis dataset and includes ZoomCharts custom Drill Down PRO visuals for Power BI.
Author's description:
🌐 Discovering the Dynamics of Technical Support with 'Comprehensive Technical Support Analysis Dashboard'
🚀 Exciting Exploration of Technical Support Data:
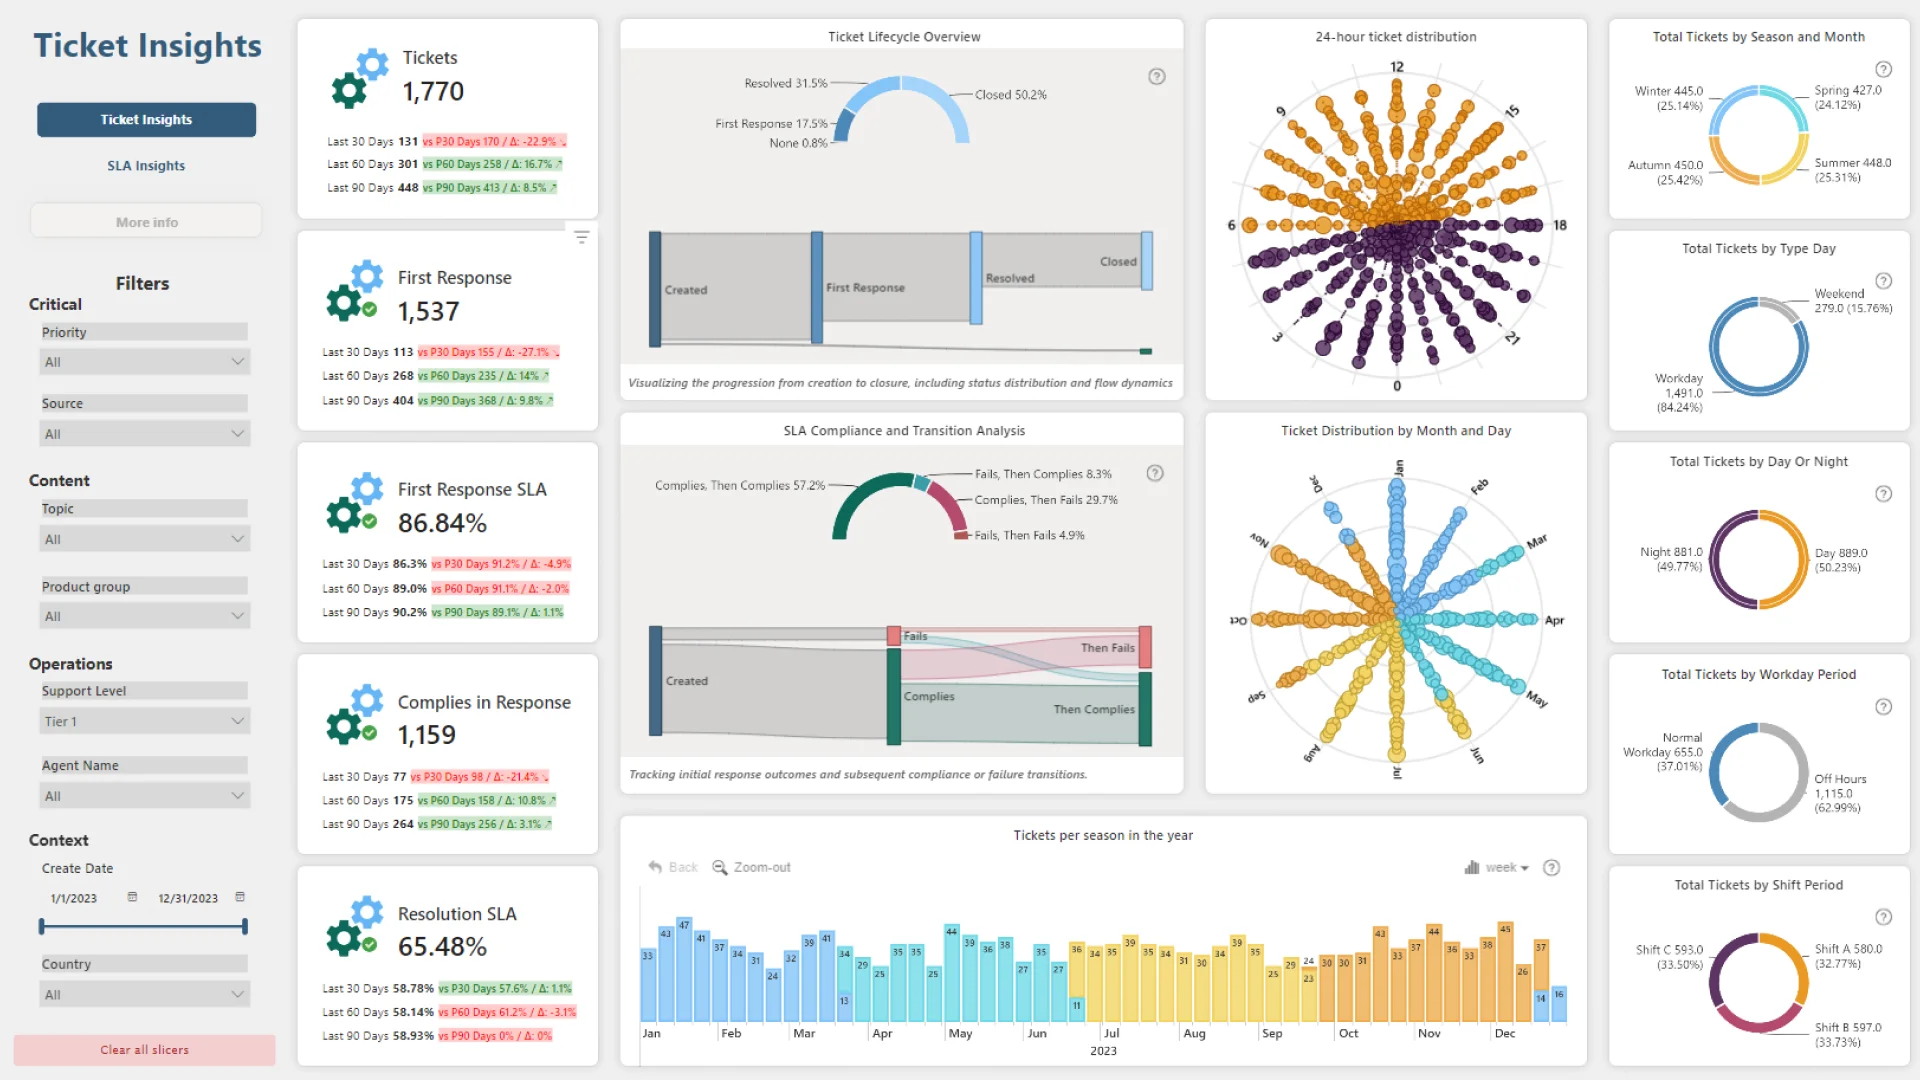
Introducing the "Comprehensive Technical Support Analysis Dashboard," a powerful tool designed to provide deep insights into the world of technical support. This dashboard leverages advanced visualizations and interactive elements to analyze key performance indicators (KPIs) crucial for maintaining efficient technical support systems.
📊 Innovative Visualizations and Drill Down Techniques:
The dashboard features a time chart that uses advanced visuals to analyze ticket trends by day, week, month, and quarter. Additionally, it includes cards that display ticket metrics for the last 30, 60, and 90 days. Other detailed breakdowns include: Season, Month, and Day Analysis: Visualizing ticket distribution across different seasons, months, and days. Workdays vs. Weekends: Comparing ticket volumes between workdays and weekends. Day and Night Creation: Identifying ticket creation times, differentiating between early morning, morning, afternoon, and evening, and interpreting the busiest hours in a typical workday. Shift Analysis: Analyzing tickets based on standard 8-hour work shifts.
🔍 Key Insights from the Dashboard:
24-Hour Ticket Distribution and Ticket Distribution by Month and Day: Using scatter plots, the distribution of tickets is presented in a radial chart, distinguishing between day and night hours for one chart, and seasonal variations for the other. Sankey Diagrams: These diagrams illustrate the flow of tickets through various statuses, providing a clear view of the ticket lifecycle. Status Transition Tracking: A detailed view showing the status transitions of tickets, helping to identify bottlenecks and improve workflow efficiency.
Guided Tour Feature: Enhancing user experience by providing a guided tour to help users navigate and understand the dashboard better.
Mobile view allows you to interact with the report. To Download the template please switch to desktop view.