Feel free to leave your vote:
1
Share template with others
Summary
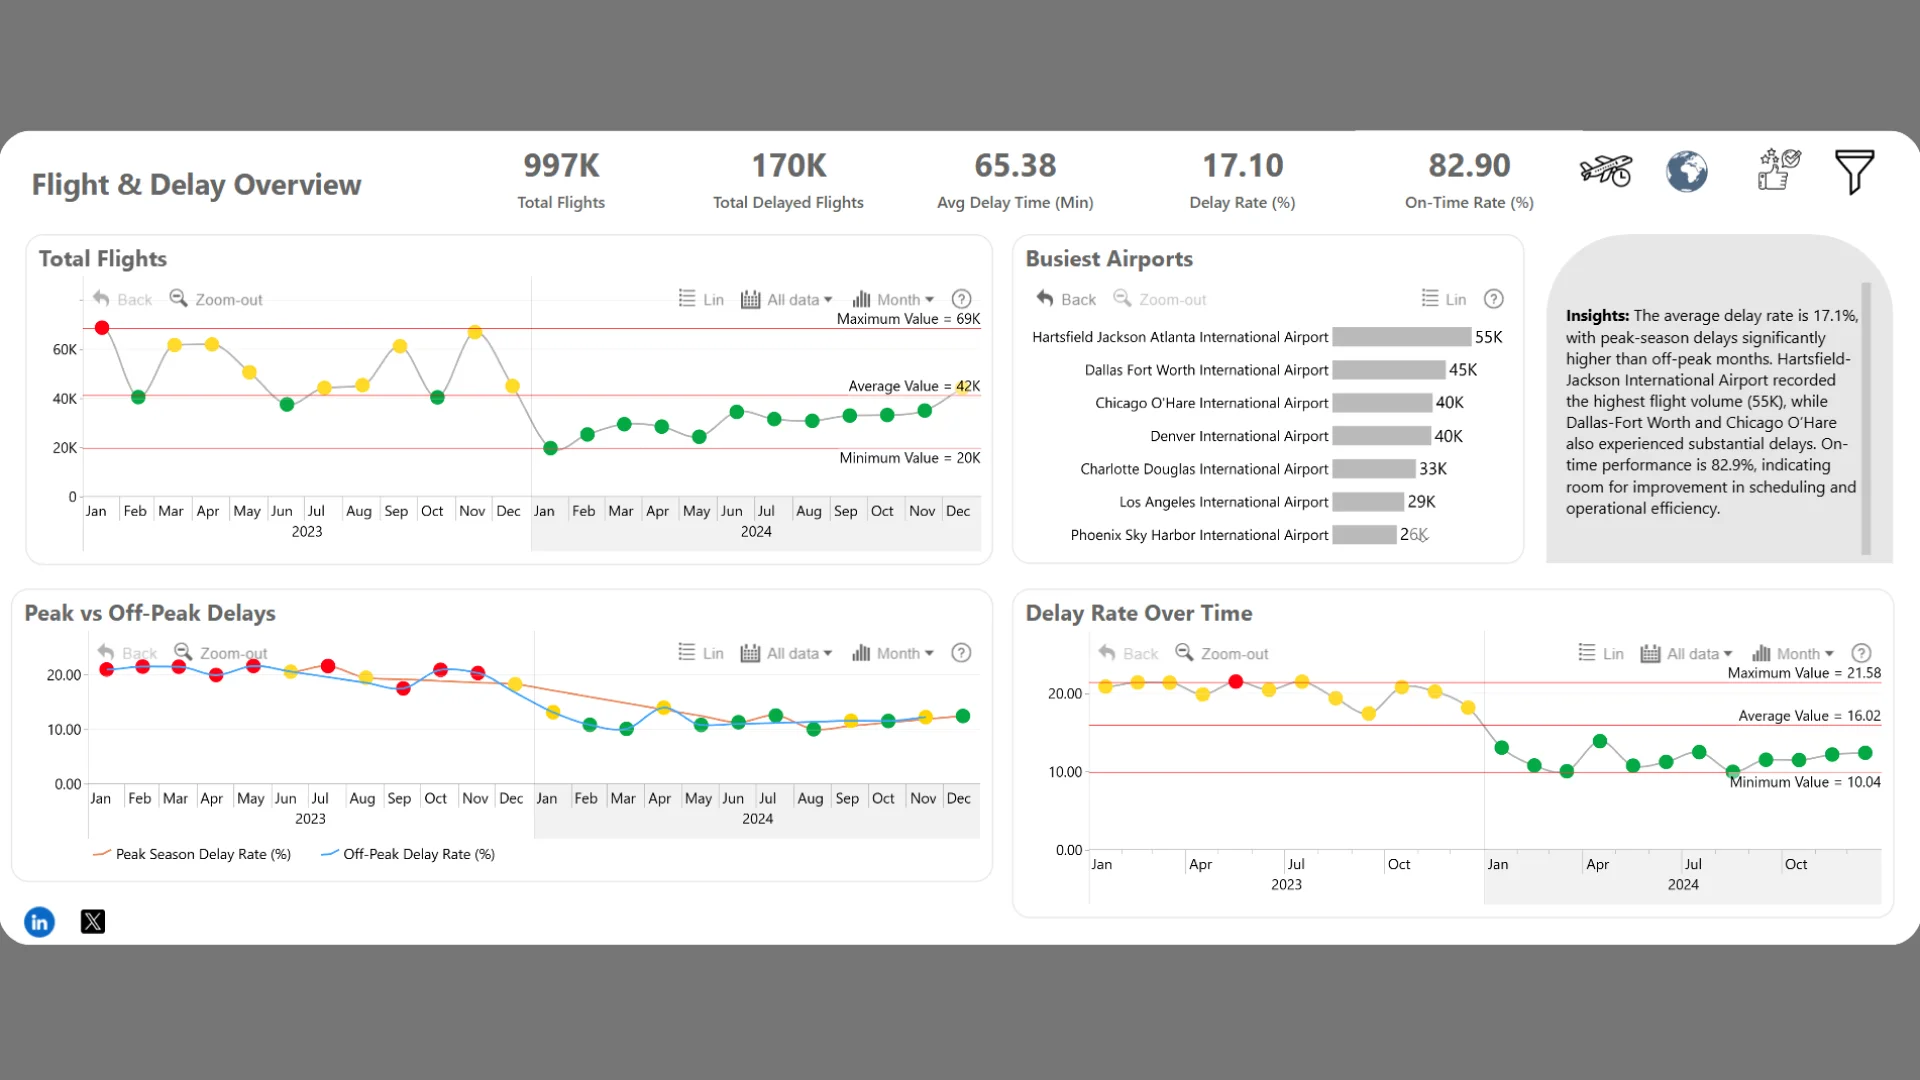
Report submitted for the FP20 Analytics ZoomCharts Challenge, January 2025. The report was built using the Airline Delays Dataset and includes ZoomCharts custom Drill Down PRO visuals for Power BI.
Author's description:
This project analyzes airline delays to uncover key factors affecting flight punctuality, including weather conditions, carrier operations, and airport efficiency. Using Power BI and ZoomCharts, the analysis visualizes delay patterns, compares peak vs. off-peak performance, and identifies high-delay airports and carriers. The insights help airlines optimize schedules, improve operational strategies, and enhance overall passenger experience.
ZoomCharts visuals used
Mobile view allows you to interact with the report. To Download the template please switch to desktop view.