Feel free to leave your vote:
15
Share template with others
Summary
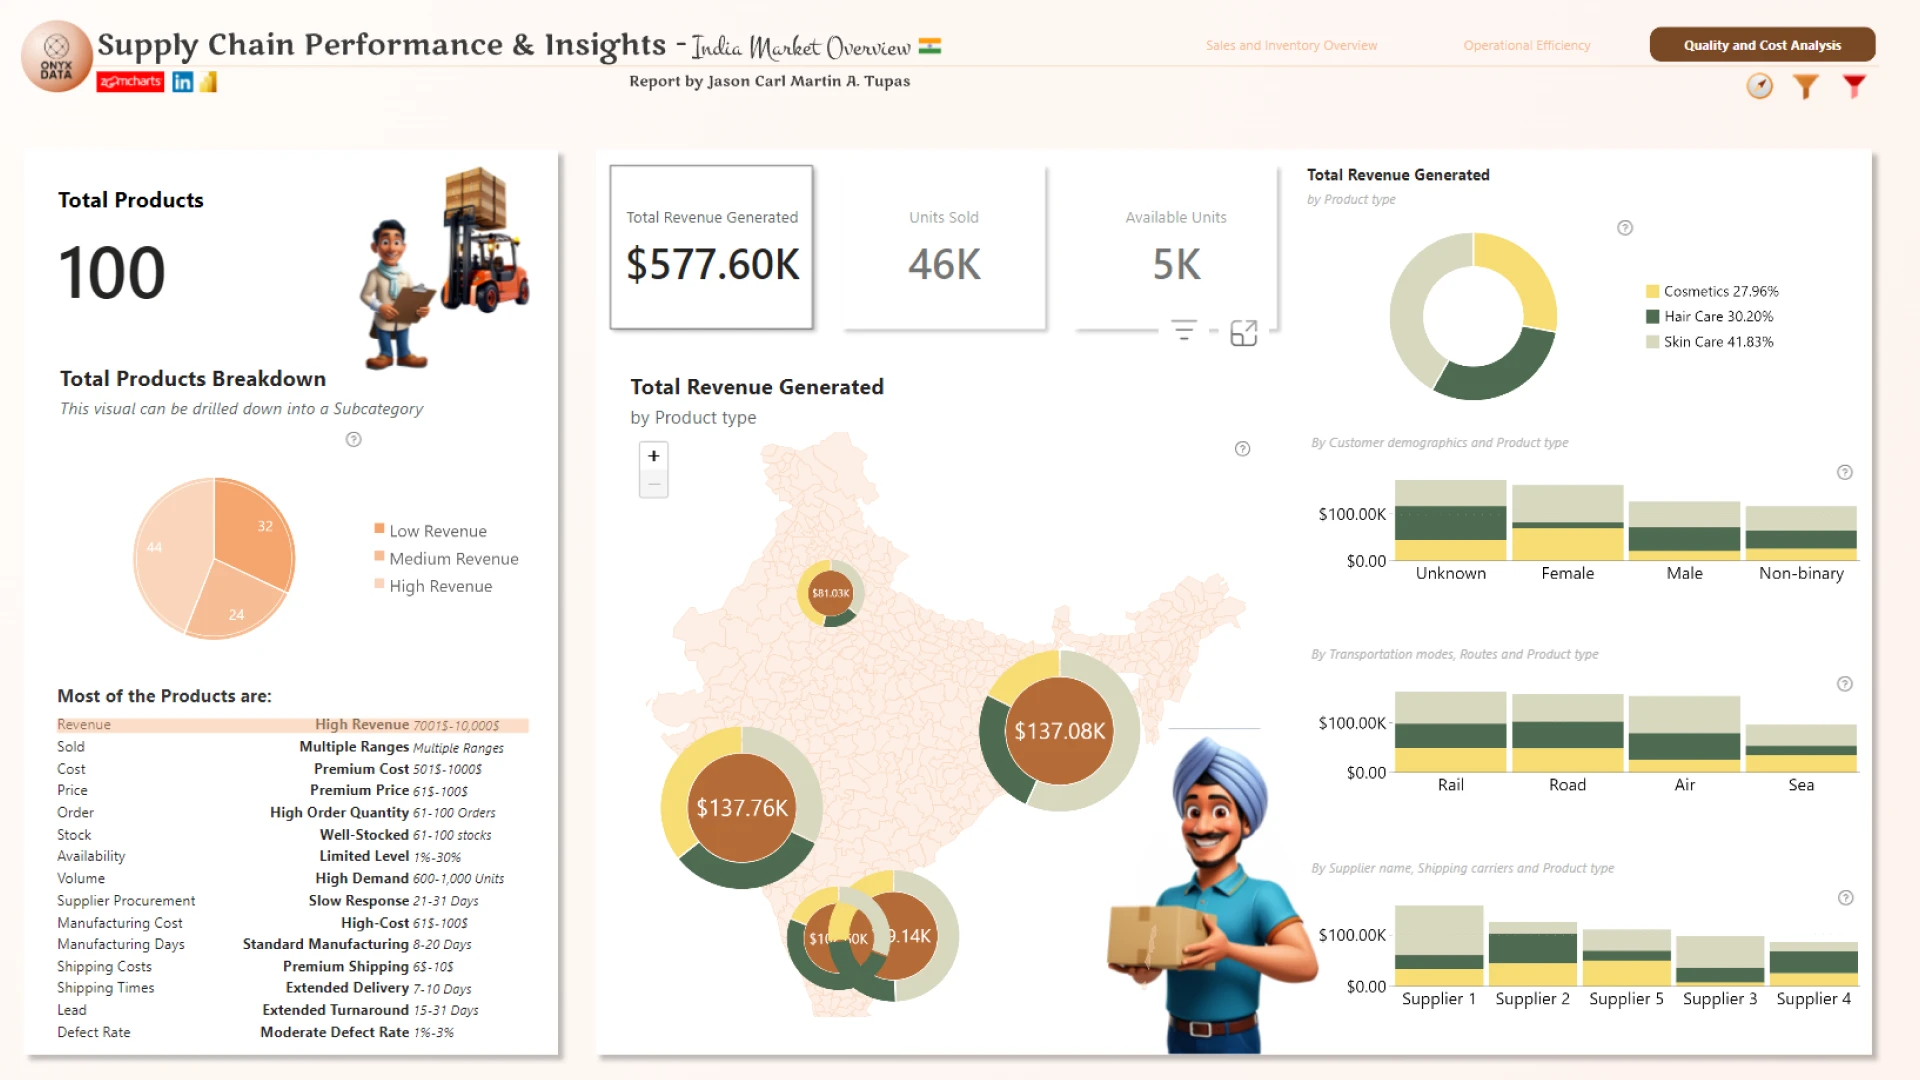
Report submitted for Onyx Data DataDNA ZoomCharts Mini Challenge, November 2024. The report is based on the Supply Chain Analysis dataset and includes ZoomCharts custom Drill Down PRO visuals for Power BI.
Author's description:
For this challenge, I designed an interactive Power BI report that provides a detailed analysis of sales and inventory, operational efficiency, and quality and cost metrics. The report empowers stakeholders to make data-driven decisions, optimize logistics, and improve profitability.I utilized the very new Scatter Visual of ZoomCharts, in which I added some enhancements using other native visuals.With a clean layout and intuitive navigation, the report includes:
✅ A guided report tour to highlight key features
✅ A smart filter pane for seamless data exploration
✅ A remove filter across all pages
Mobile view allows you to interact with the report. To Download the template please switch to desktop view.
