Feel free to leave your vote:
4
Share template with others
Summary
Report submitted for Onyx Data DataDNA ZoomCharts Mini Challenge, January 2024. The report was built based on Udemy Courses dataset and includes ZoomCharts custom Drill Down PRO visuals for Power BI.
Author's description:
Key Observation and Insight:
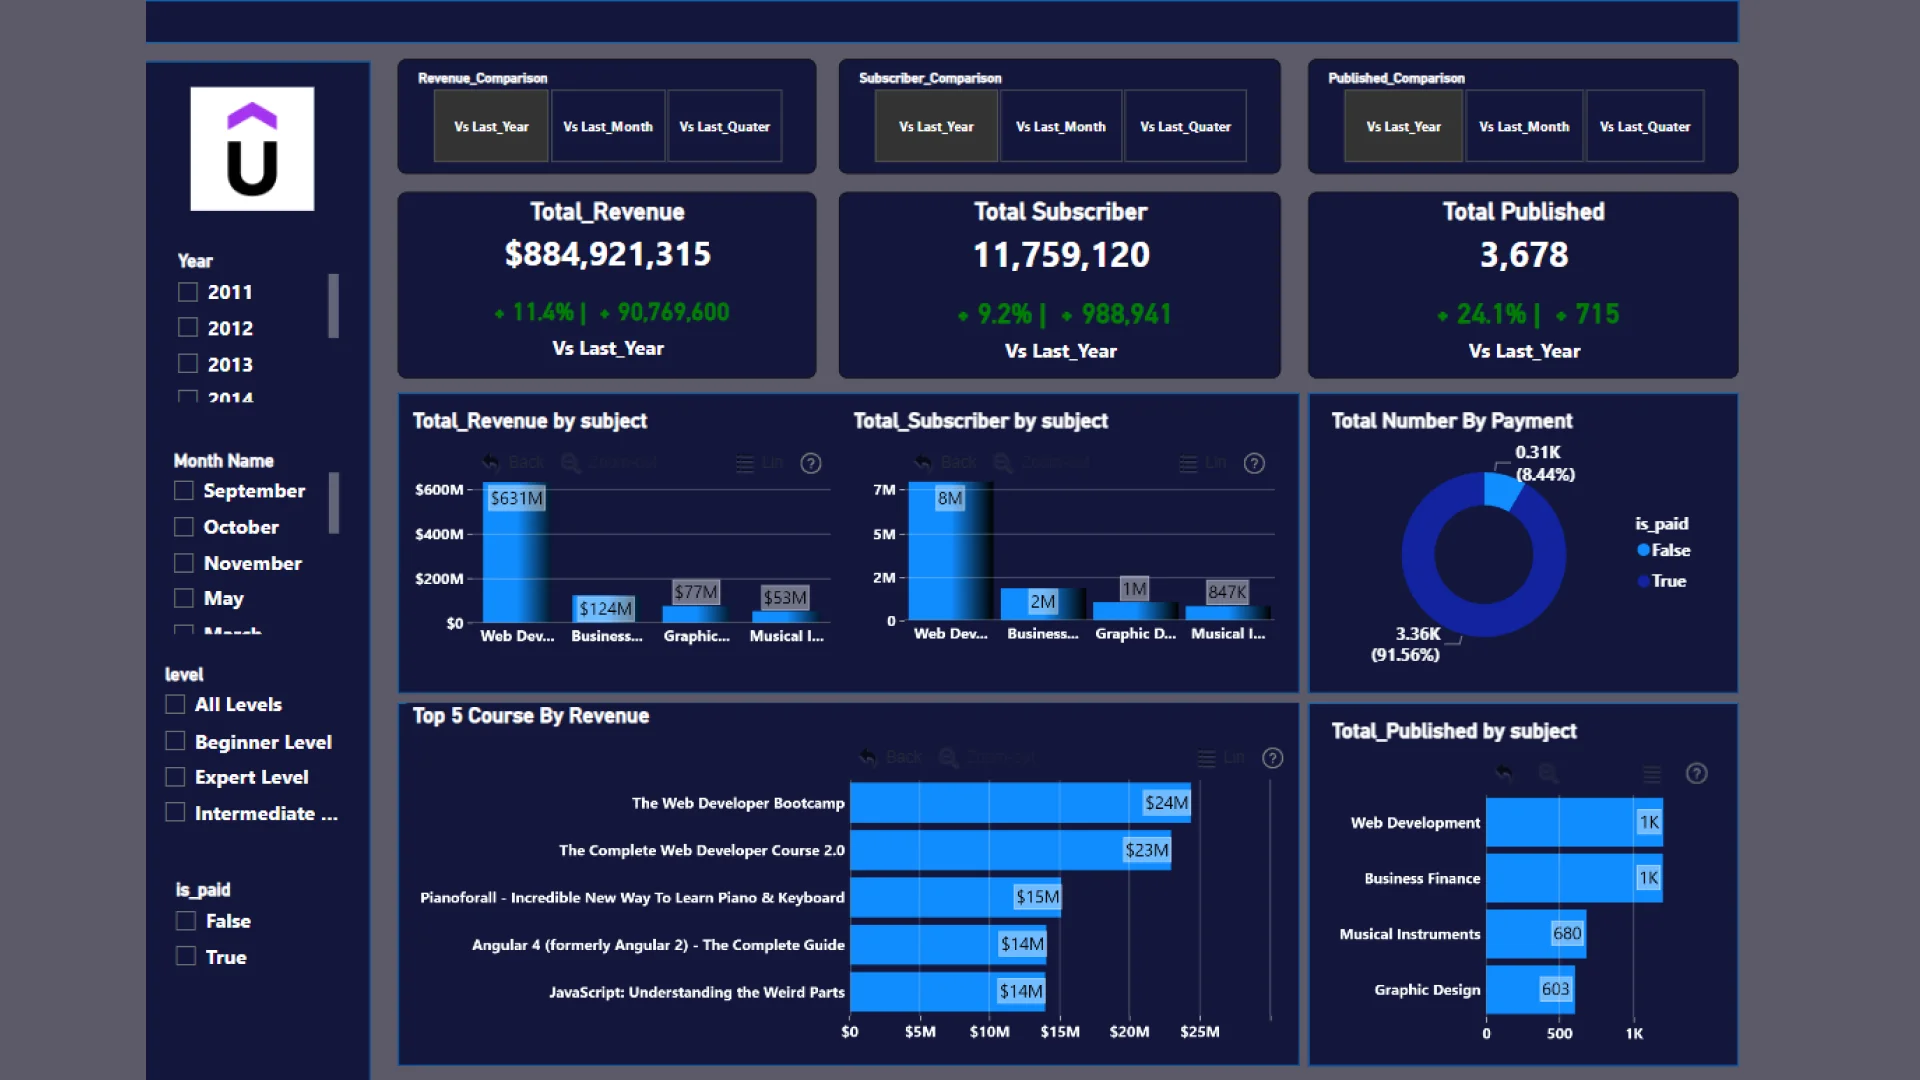
Web Development appears to be the most lucrative category, contributing significantly to the total revenue with $630,843,775. Other categories, such as Business Finance, Graphic Design, and Musical Instruments, contribute to the overall revenue but to a lesser extent compared to Web Development. Web Development dominates with a significant contribution of approximately 71.30% to the total revenue.
Top Revenue Courses: The Web Developer Bootcamp and The Complete Web Developer Course 2.0 are the top two revenue-generating courses, contributing significantly to the overall total revenue.
Diversity in Content: The top courses cover a diverse range of topics, including web development, piano and keyboard learning, Angular, and advanced JavaScript. This suggests a broad audience with varied interests. The number of published items is distributed across the categories, with Web Development and Business Finance having the highest counts. Web Development and Business Finance together contribute a significant portion of the published items, with a combined percentage of around 65.12% The majority of items on the platform are categorized as paid, constituting approximately 91.57% of the total. Not paid items make up a smaller percentage, accounting for approximately 8.43% of the total.
The revenue model of the platform is heavily oriented towards paid content. Strategies to increase revenue might involve optimizing pricing, offering subscription plans, or introducing new premium content.
Mobile view allows you to interact with the report. To Download the template please switch to desktop view.