Feel free to leave your vote:
0
Share template with others
Summary
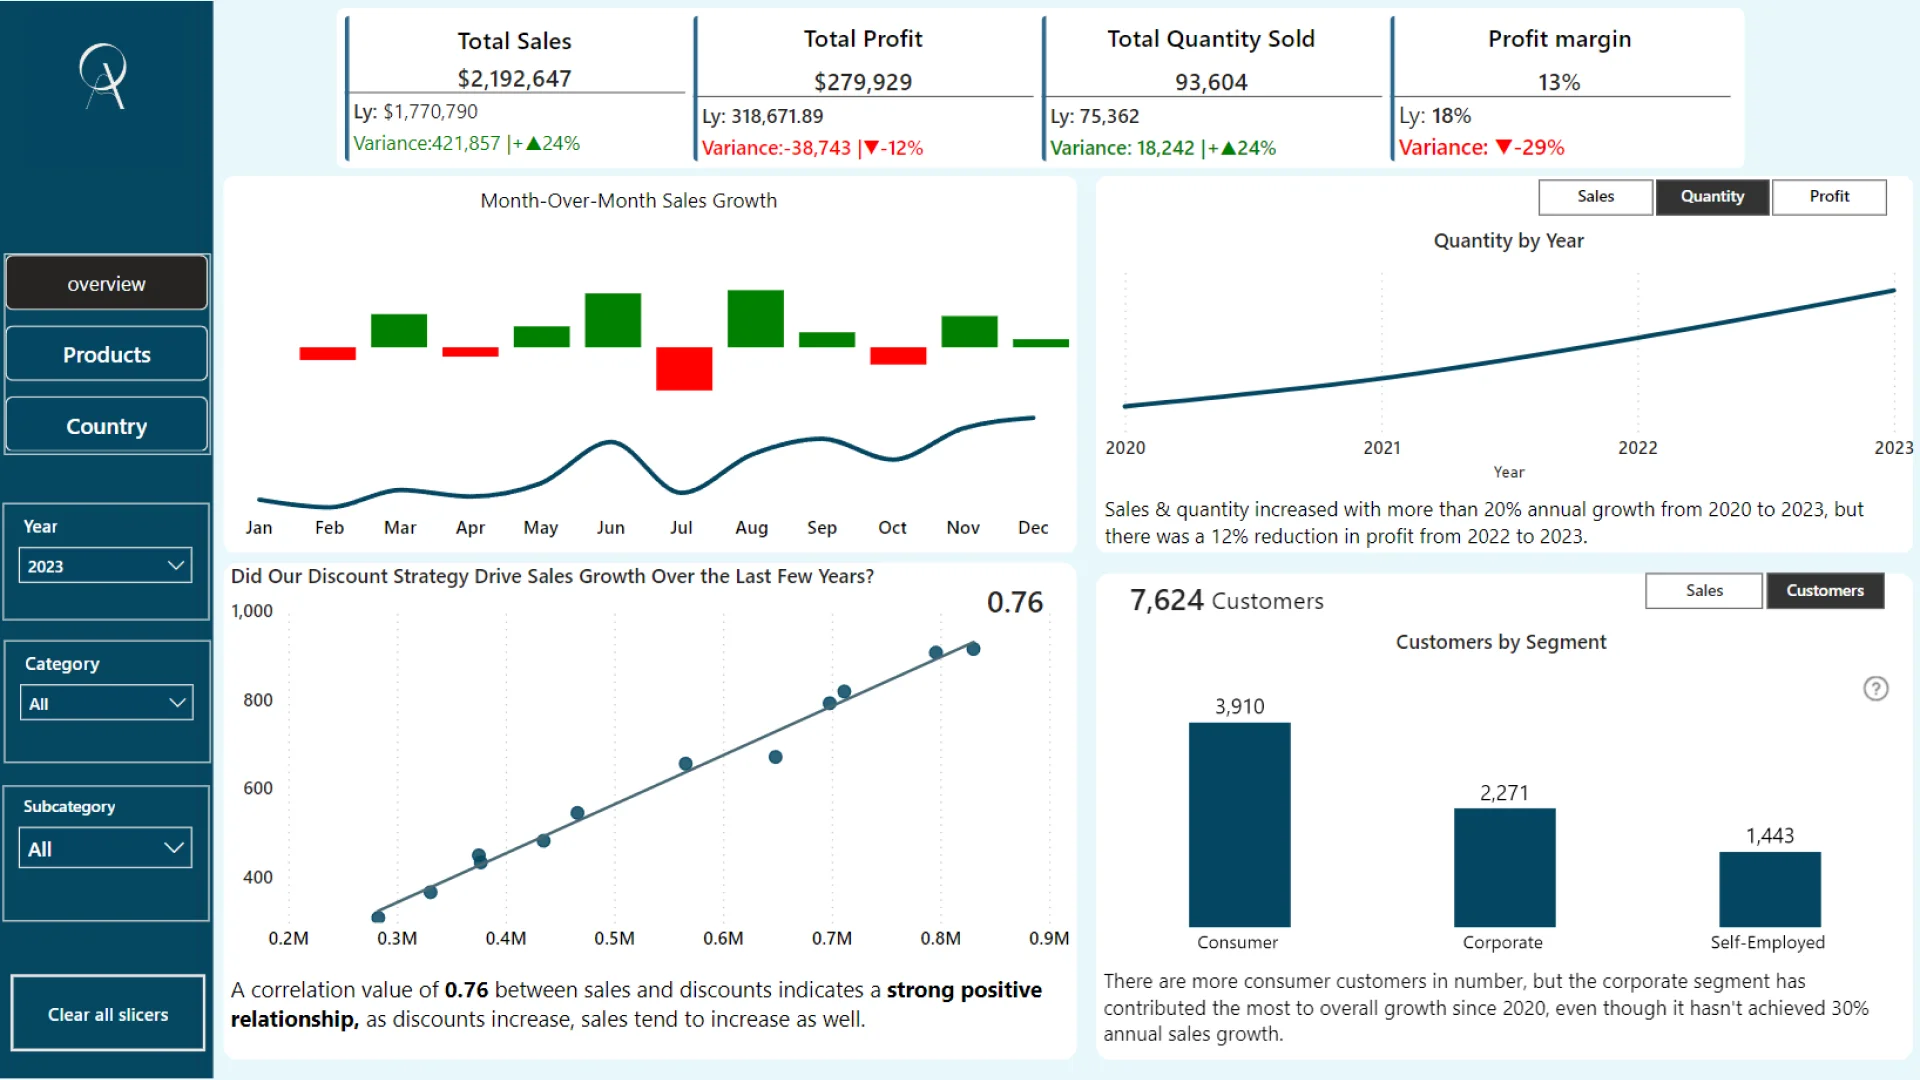
Report submitted for FP20 Analytics ZoomCharts Challenge 19 (September 2024). The report was built with the E-commerce KPI Analysis dataset and includes ZoomCharts custom Drill Down PRO visuals for Power BI.
Author's description:
I created an interactive Power BI dashboard for a cosmetics company, analyzing product sales, profitability, and market trends. The dashboard highlights key insights, such as top-performing products, declining profit categories, and customer segmentation. It provides a dynamic view of sales performance to support strategic decision-making.
Mobile view allows you to interact with the report. To Download the template please switch to desktop view.
