Feel free to leave your vote:
1
Share template with others
Summary
Report submitted for FP20 Analytics ZoomCharts Challenge 16 (May 2024). The report was built with the Coffee Roaster Dataset and includes ZoomCharts custom Drill Down PRO visuals for Power BI.
Author's description:
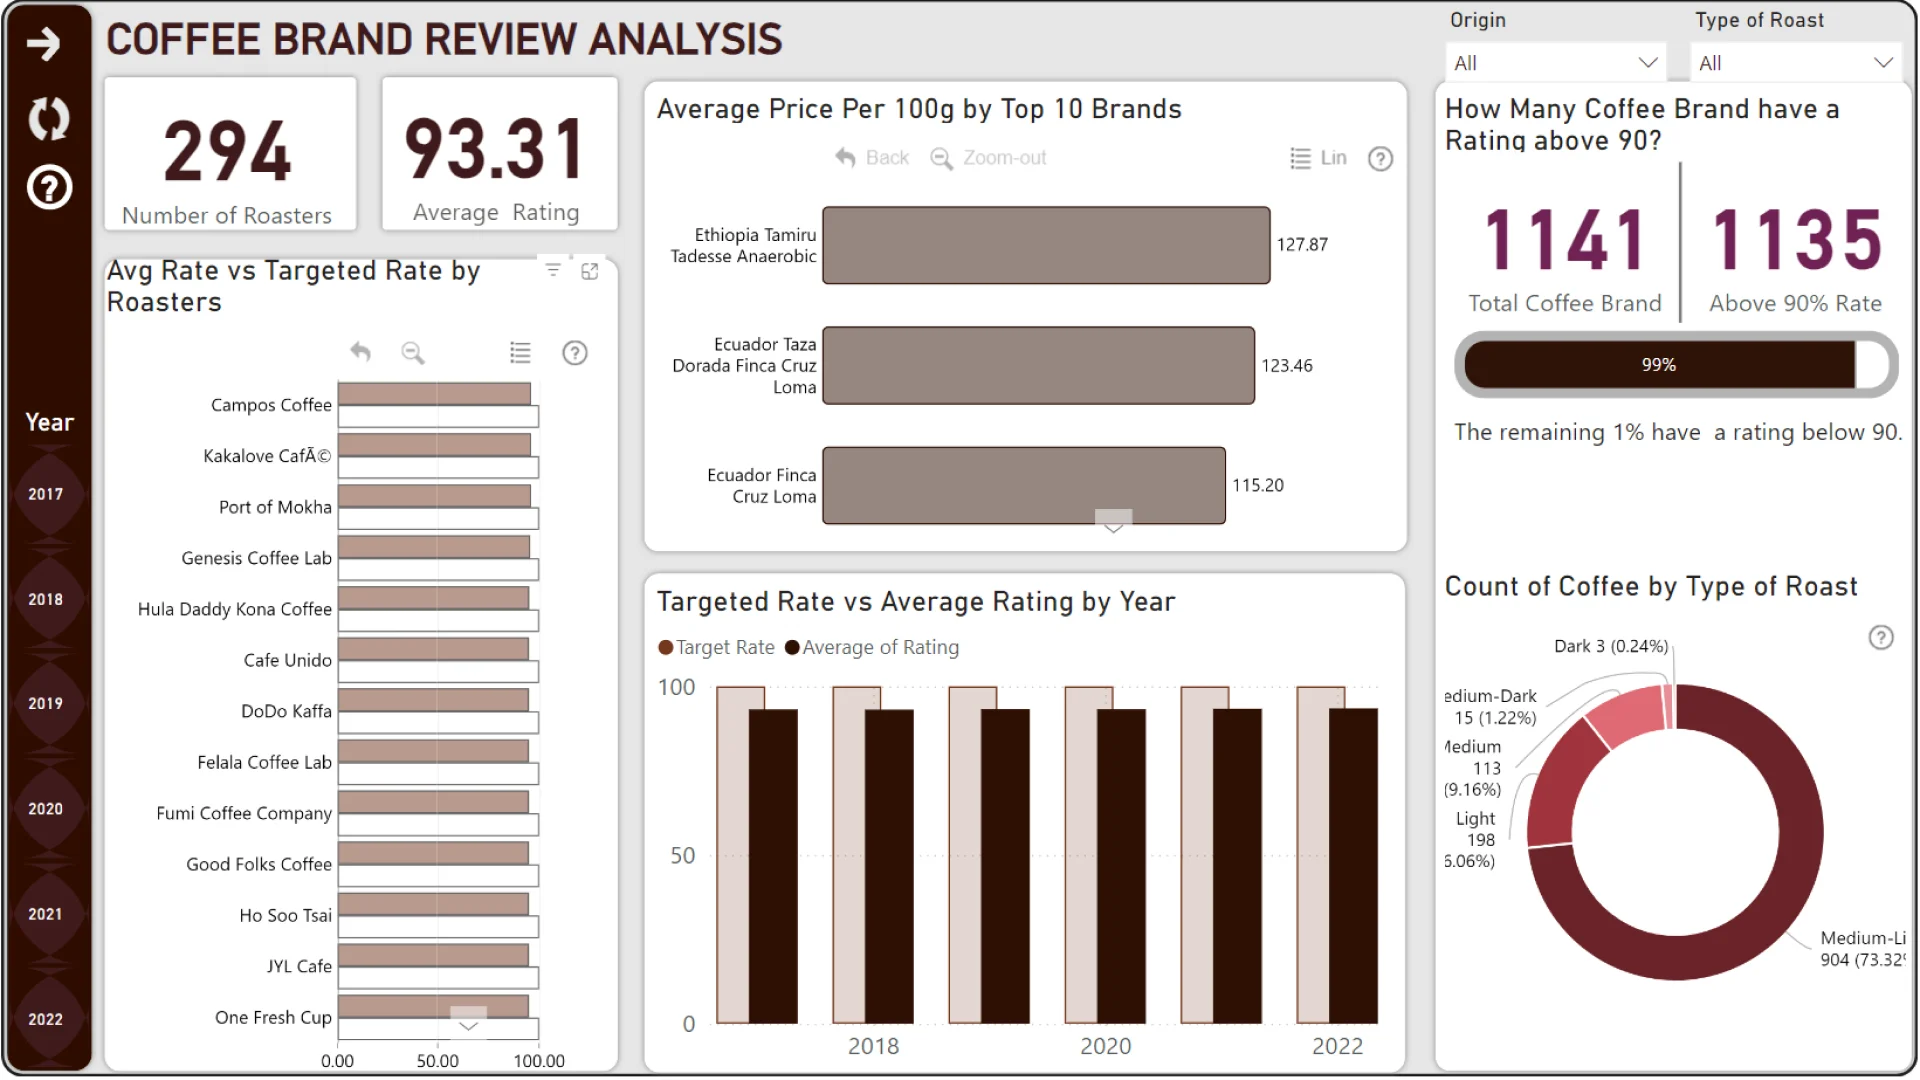
Analyzed the average rating versus the targeted rating by the roasters and by year, the average price per 100g by brands, and the coffee brands with ratings above 90. Also analyzed the number of coffees by type of roast, the average rating of coffees by origin, and the count of coffees by origin and brand. Additionally, examined the coffee aroma from North America and the top 5 coffee brands in Asian countries, including the mouthfeel of the coffees.
Key Findings:
- Campos Coffee and Kakalove Cafac brands received the highest ratings with 96.
- Ecuador Taza Dorada Finca Cruz Loma had the highest price per 100g in 2022.
- Coffee originating from Ecuador had the highest rating of 94.67, followed by Panama in 2022. The lowest rating was 92 from Mexico and Brazil in the same year.
- Ethiopia had the highest number of coffee origins with a total of 88 in 2022, while Yemen had the lowest with just 1.
- North American coffees had a chocolate aroma in 2022, while coffees from Asian countries had an acidic mouthfeel.
Mobile view allows you to interact with the report. To Download the template please switch to desktop view.