Feel free to leave your vote:
20
Share template with others
Summary
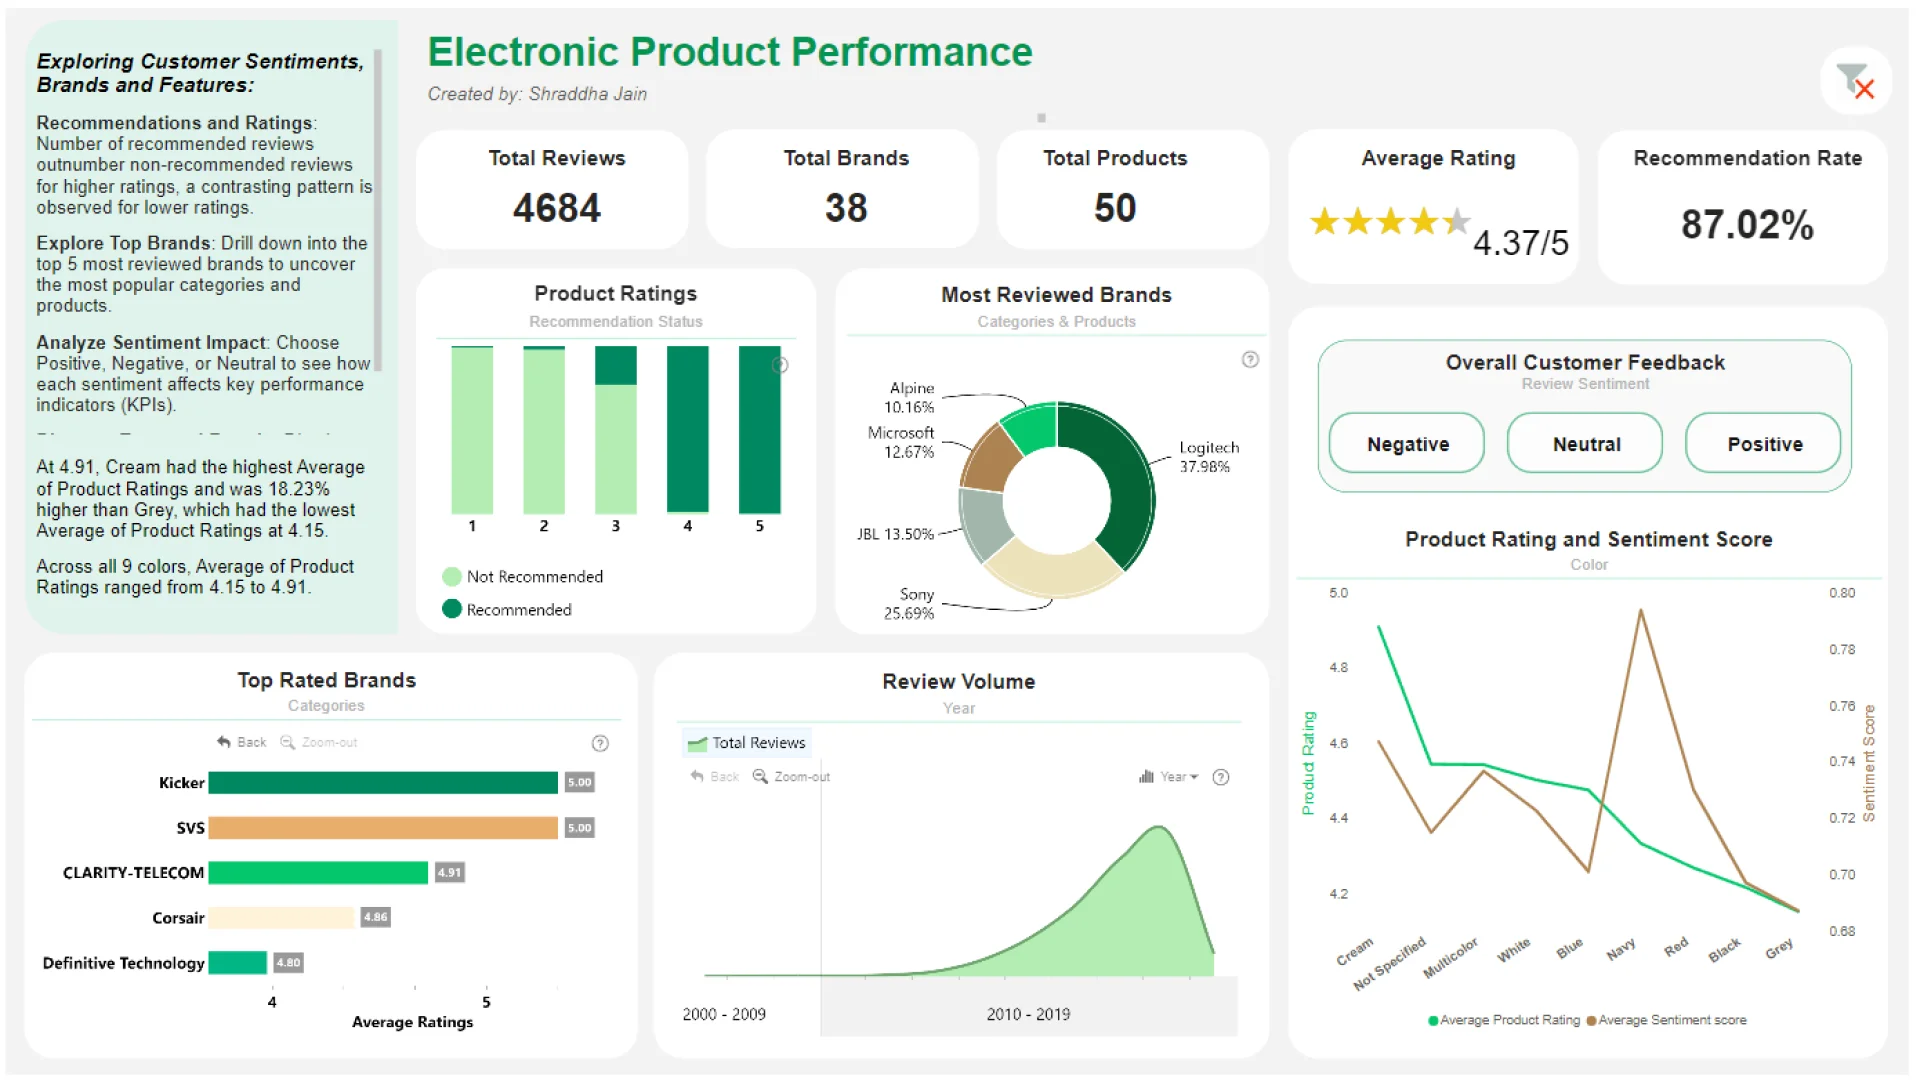
Report submitted for Onyx Data DataDNA ZoomCharts Mini Challenge, February 2024. The report was built based on Electronics Product Data Ratings dataset and includes ZoomCharts custom Drill Down PRO visuals for Power BI.
Author's description:
This is my submission for the DataDNA challenge - Electronic Products Rating.
Tool: Power BI
Dataset: Electronic Products Rating Dataset
Below are some of the report features and highlights:
- Analyzing Review Recommendations and Ratings: Recommended reviews outnumber non-recommended ones in higher ratings; contrasting patterns in lower ratings.
- Exploring Leading Brands: Drill down into the top 5 most reviewed brands to uncover popular categories and products.
- Assessing Sentimental Influence: Examine positive, negative, or neutral sentiments to understand their impact on key performance indicators (KPIs).
- Discovering Top-Rated Brands: Investigate highest-rated brands by drilling down to identify best-rated categories within each.
ZoomCharts visuals used
Mobile view allows you to interact with the report. To Download the template please switch to desktop view.
