Feel free to leave your vote:
7
Share template with others
Summary
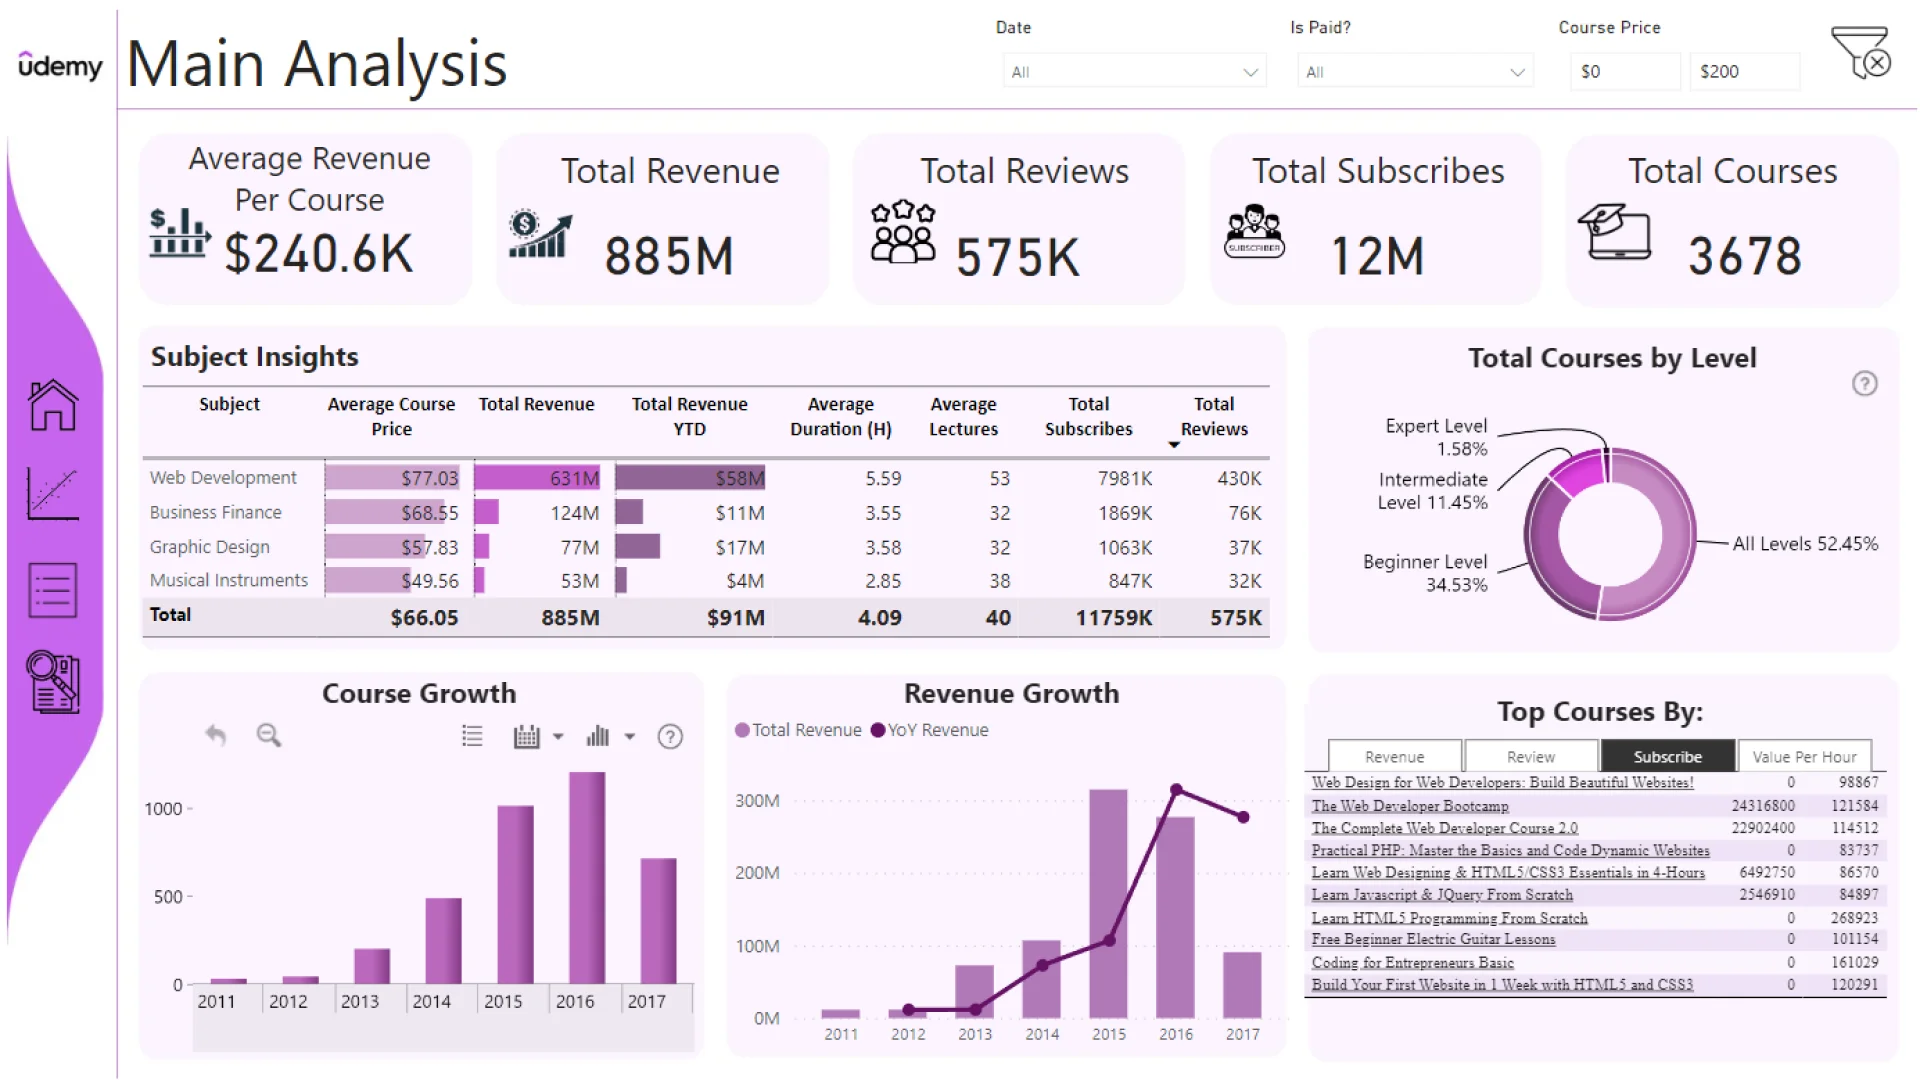
Report submitted for Onyx Data DataDNA ZoomCharts Mini Challenge, January 2024. The report was built based on Udemy Courses dataset and includes ZoomCharts custom Drill Down PRO visuals for Power BI.
Author's description:
I have implemented filters on the dashboard to make it easier for users to investigate the relationships between indicators. To display the top 10 courses among all, I decided to allow users to select and view these top courses using a slider placed above the table. Users can dynamically select the top 10 courses based on the highest revenue, most subscribers, highest reviews, and the highest value per hour. Regarding the value created per hour, my goal was to identify courses with the least deviation that generate the highest revenue. While this metric alone may not be comprehensive, its presence is essential.
My analysis of this information is as follows: The analysis reveals that 8.43% of courses are available for free, constituting more than 30% of total subscribers. Additionally, 42% fall within the category of free and affordable courses (priced under $20), reflecting a preference for cost-effective learning. In terms of revenue, the "All Level," primarily driven by Web Development, holds a dominant position with a 71.29% share.
Notably, Web Development, across all levels except the "Expert Level," commands the largest portion of revenue, reviews, and subscribers, accounting for approximately 70% of the total. Conversely, business finance outperforms other categories in the "Expert Level." Moreover, in the Business Finance subject, excluding the "Expert Level," subscribers tend to favor free courses.
To foster subscriber growth, it is recommended to introduce more free and affordable courses, with a specific focus on "All Level" courses in Web Development. To maximize revenue, a strategic emphasis on Web Development, "All Level", and "Beginner" is crucial. These strategic adjustments align with subscriber preferences and revenue trends, intending to optimize platform performance and attract a diverse audience.
Mobile view allows you to interact with the report. To Download the template please switch to desktop view.