Feel free to leave your vote:
0
Share template with others
Summary
Report submitted for FP20 Analytics ZoomCharts Challenge 19 (September 2024). The report was built with the E-commerce KPI Analysis dataset and includes ZoomCharts custom Drill Down PRO visuals for Power BI.
Author's description:
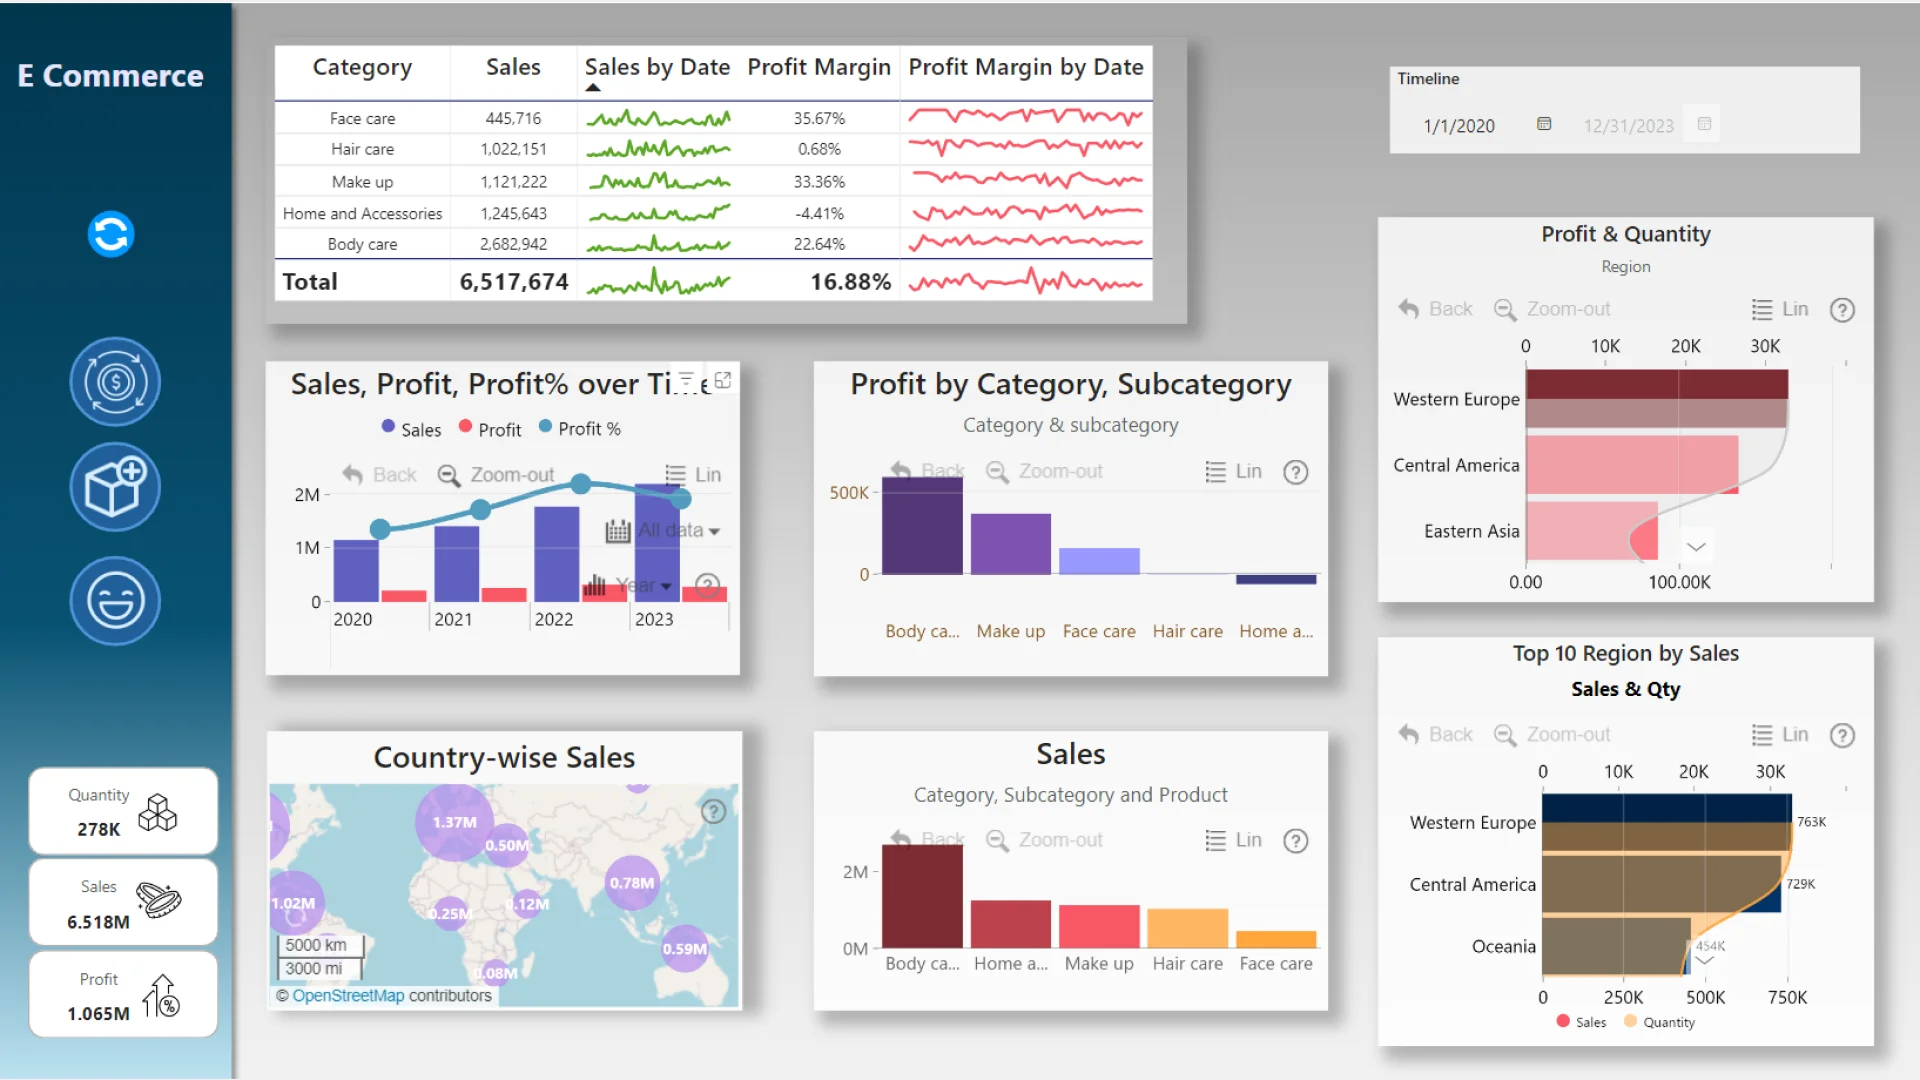
The E-Commerce KPI dashboard provides a comprehensive view of key business metrics. Dashboard consists of three key tabs: Sales, Customer, and Performance.
The Sales tab provides an overview of category-wise sales, profit, and profit margins over time, along with top-performing regions. It showcases category-wise sales, profit, and profit margins across different time periods.
The Customer tab focuses on customer behavior, including sales distribution by region and customer segmentation.
The Performance tab highlights key operational metrics such as order volume, fulfillment times, and the impact of discounts.
Each tab allows for detailed insights through dynamic filters and visualizations, helping businesses track trends, optimize strategies, and enhance overall efficiency.
ZoomCharts visuals used
Mobile view allows you to interact with the report. To Download the template please switch to desktop view.