Feel free to leave your vote:
18
Share template with others
Summary
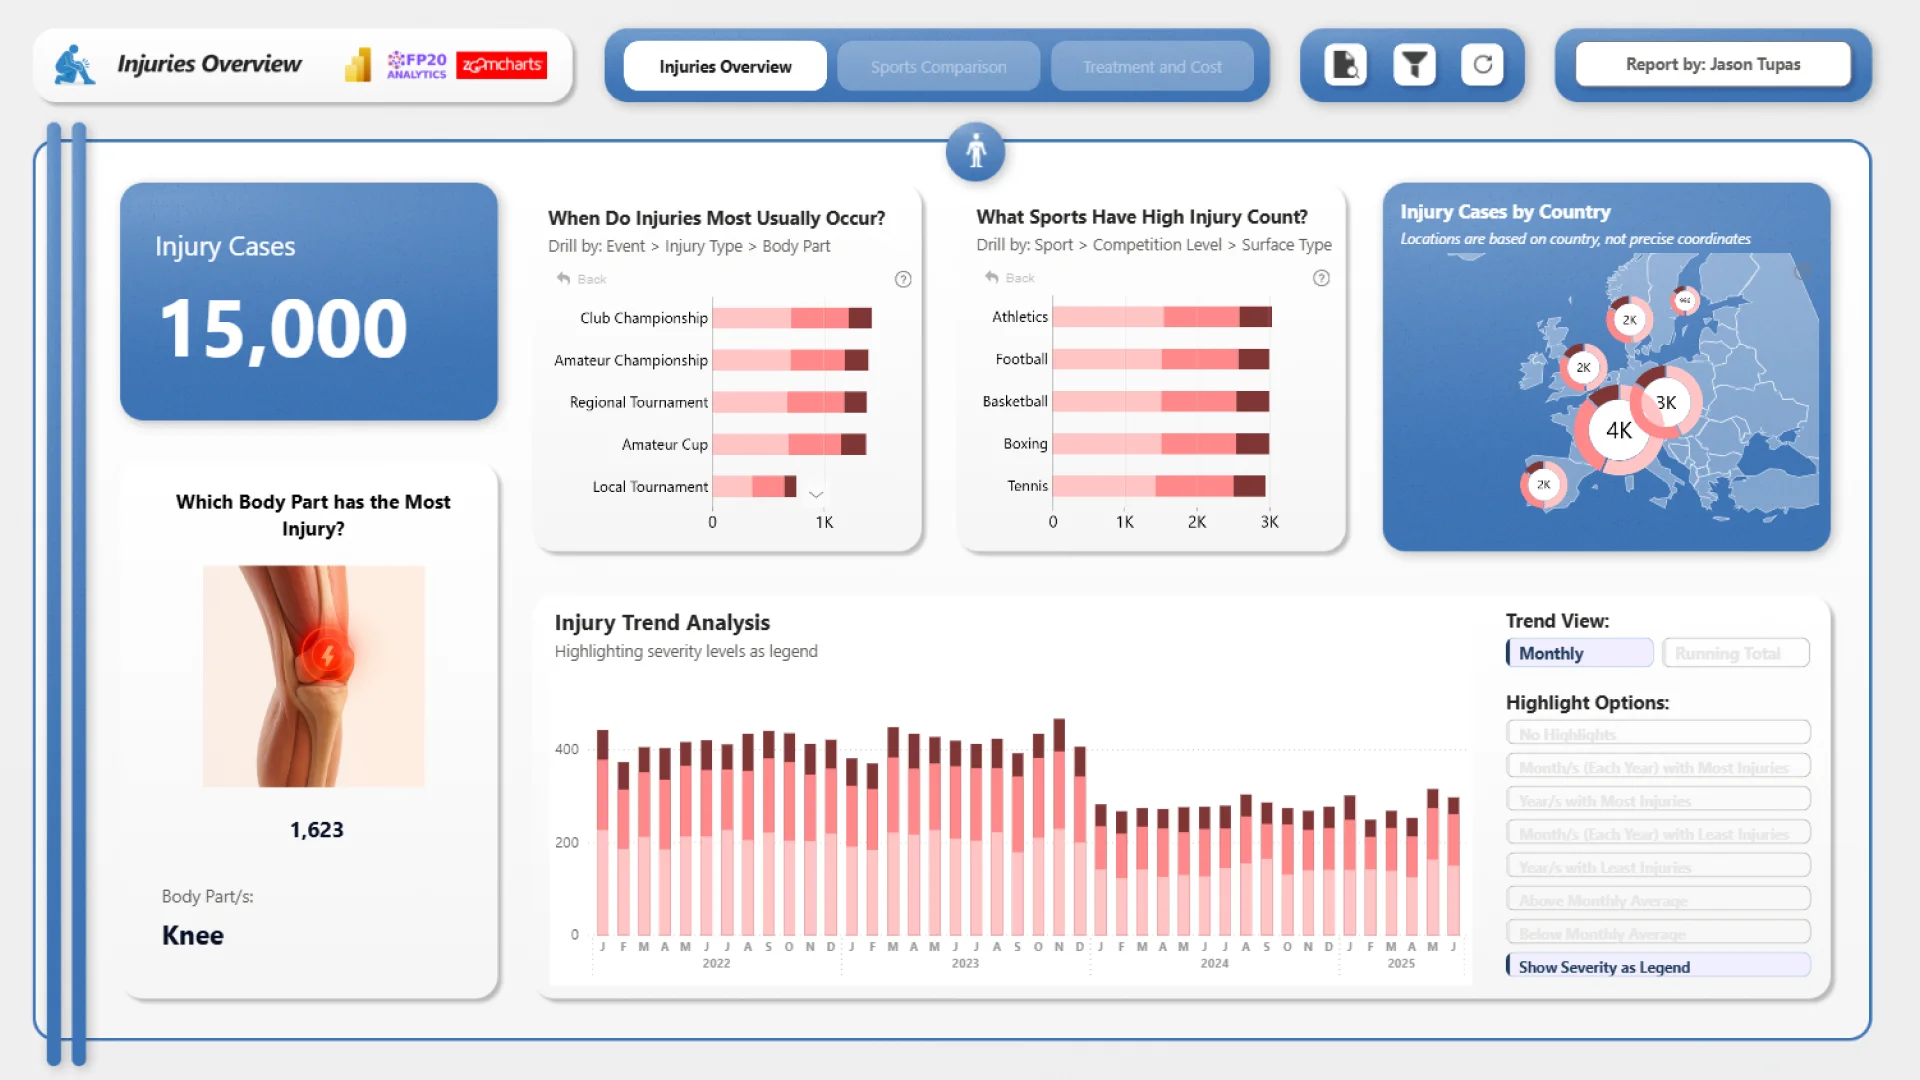
This Power BI report uses the Athlete Health and Injury dataset and features ZoomCharts Drill Down PRO custom visuals for Power BI. It was submitted to the FP20 Analytics ZoomCharts Data Challenge in August 2025.
Author's Description:
For this entry, I explored the world of sports injuries, focusing on trends that shape athlete health and recovery. Using the dataset, I broke down injuries across different categories and created a simple way to compare how they vary by sport. I also examined treatment approaches and the costs involved, highlighting how these factors influence both recovery and long-term performance. My goal was to present the data in a clear and practical way—turning thousands of records into insights that can help coaches, staff, and athletes better understand risks and make more informed decisions.
Mobile view allows you to interact with the report. To Download the template please switch to desktop view.