Feel free to leave your vote:
0
Share template with others
Summary
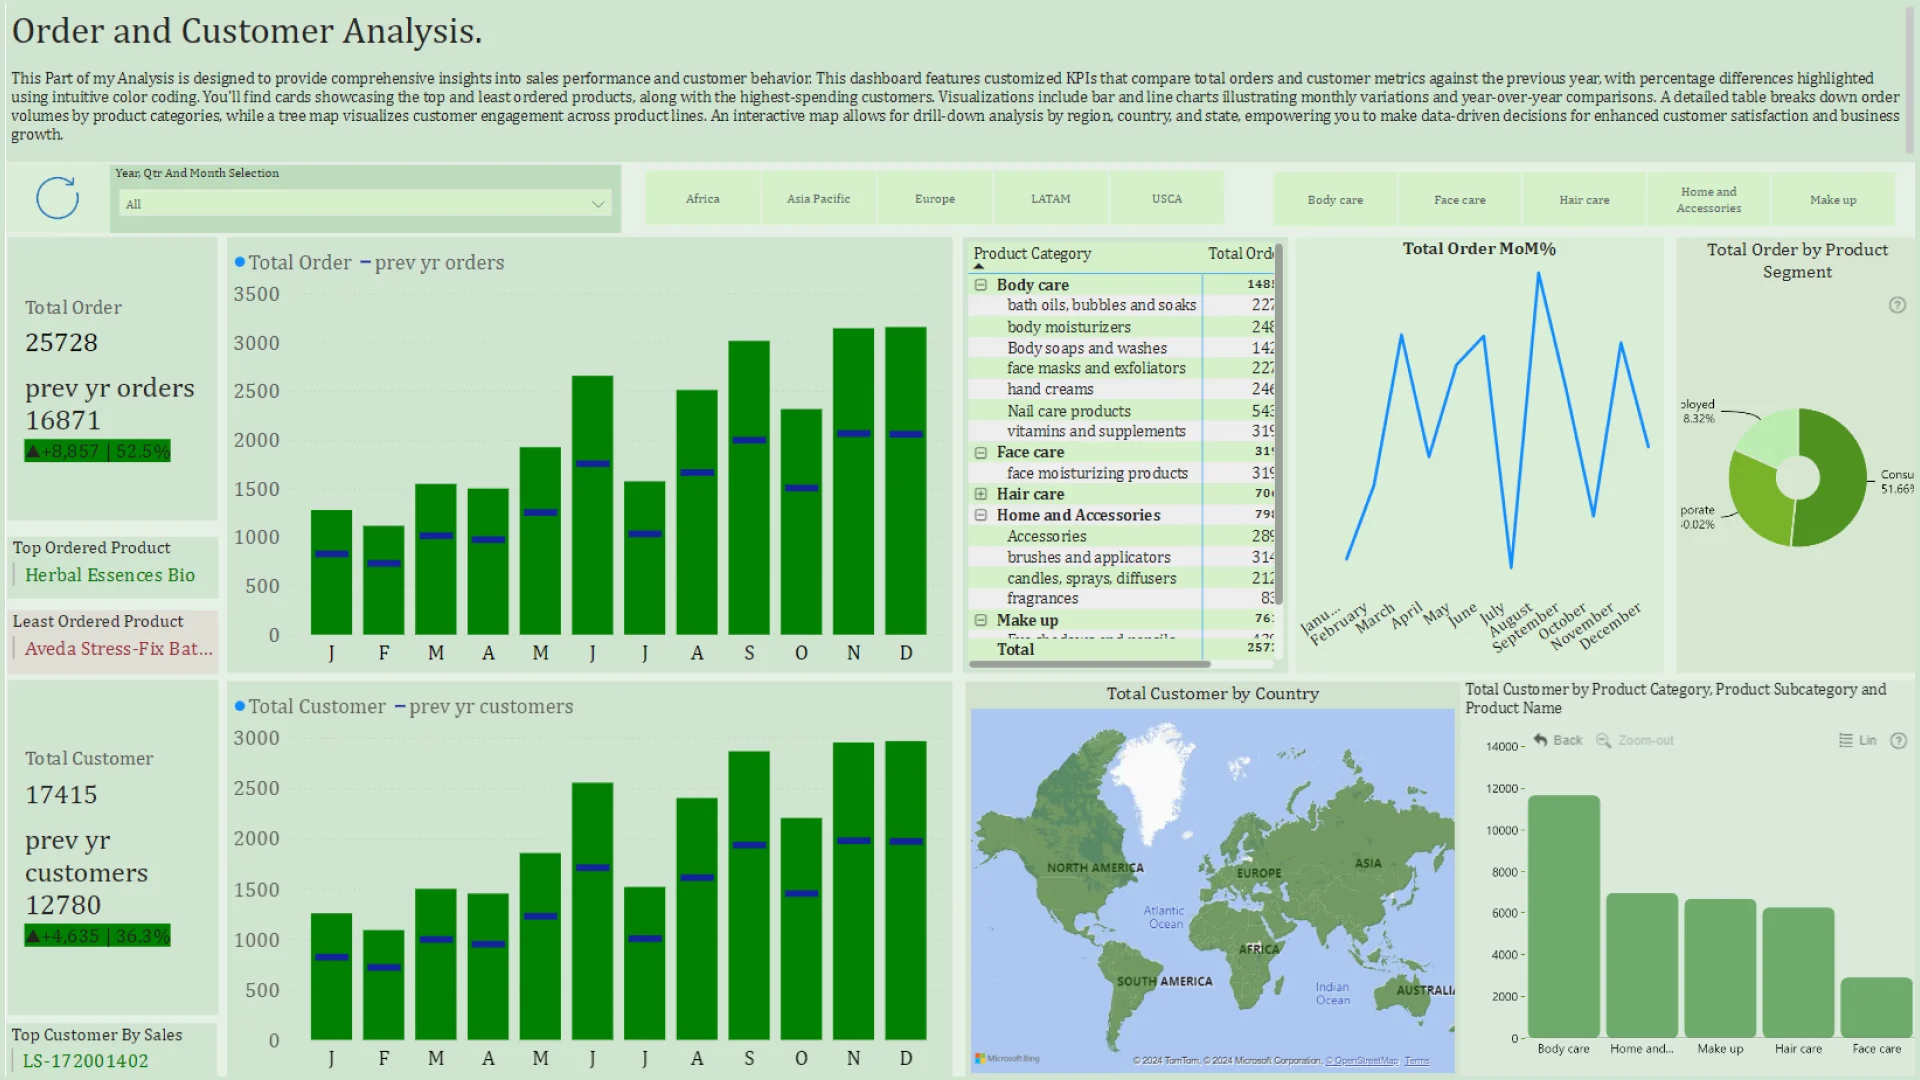
Report submitted for FP20 Analytics ZoomCharts Challenge 19 (September 2024). The report was built with the E-commerce KPI Analysis dataset and includes ZoomCharts custom Drill Down PRO visuals for Power BI.
Author's description:
I am participating in the FP20 ZoomCharts Analytics Challenge 19 💥. This is my entry for this month’s FP20 Data Visualization & Analysis Challenge. A big thank you to @FP20analytics, Federico Pastor, and @ZoomCharts for providing the platform and tools to create this engaging dashboard!
Mobile view allows you to interact with the report. To Download the template please switch to desktop view.