Feel free to leave your vote:
21
Share template with others
Summary
Report submitted for Onyx Data DataDNA ZoomCharts Mini Challenge, January 2024. The report was built based on Udemy Courses dataset and includes ZoomCharts custom Drill Down PRO visuals for Power BI.
Author's description:
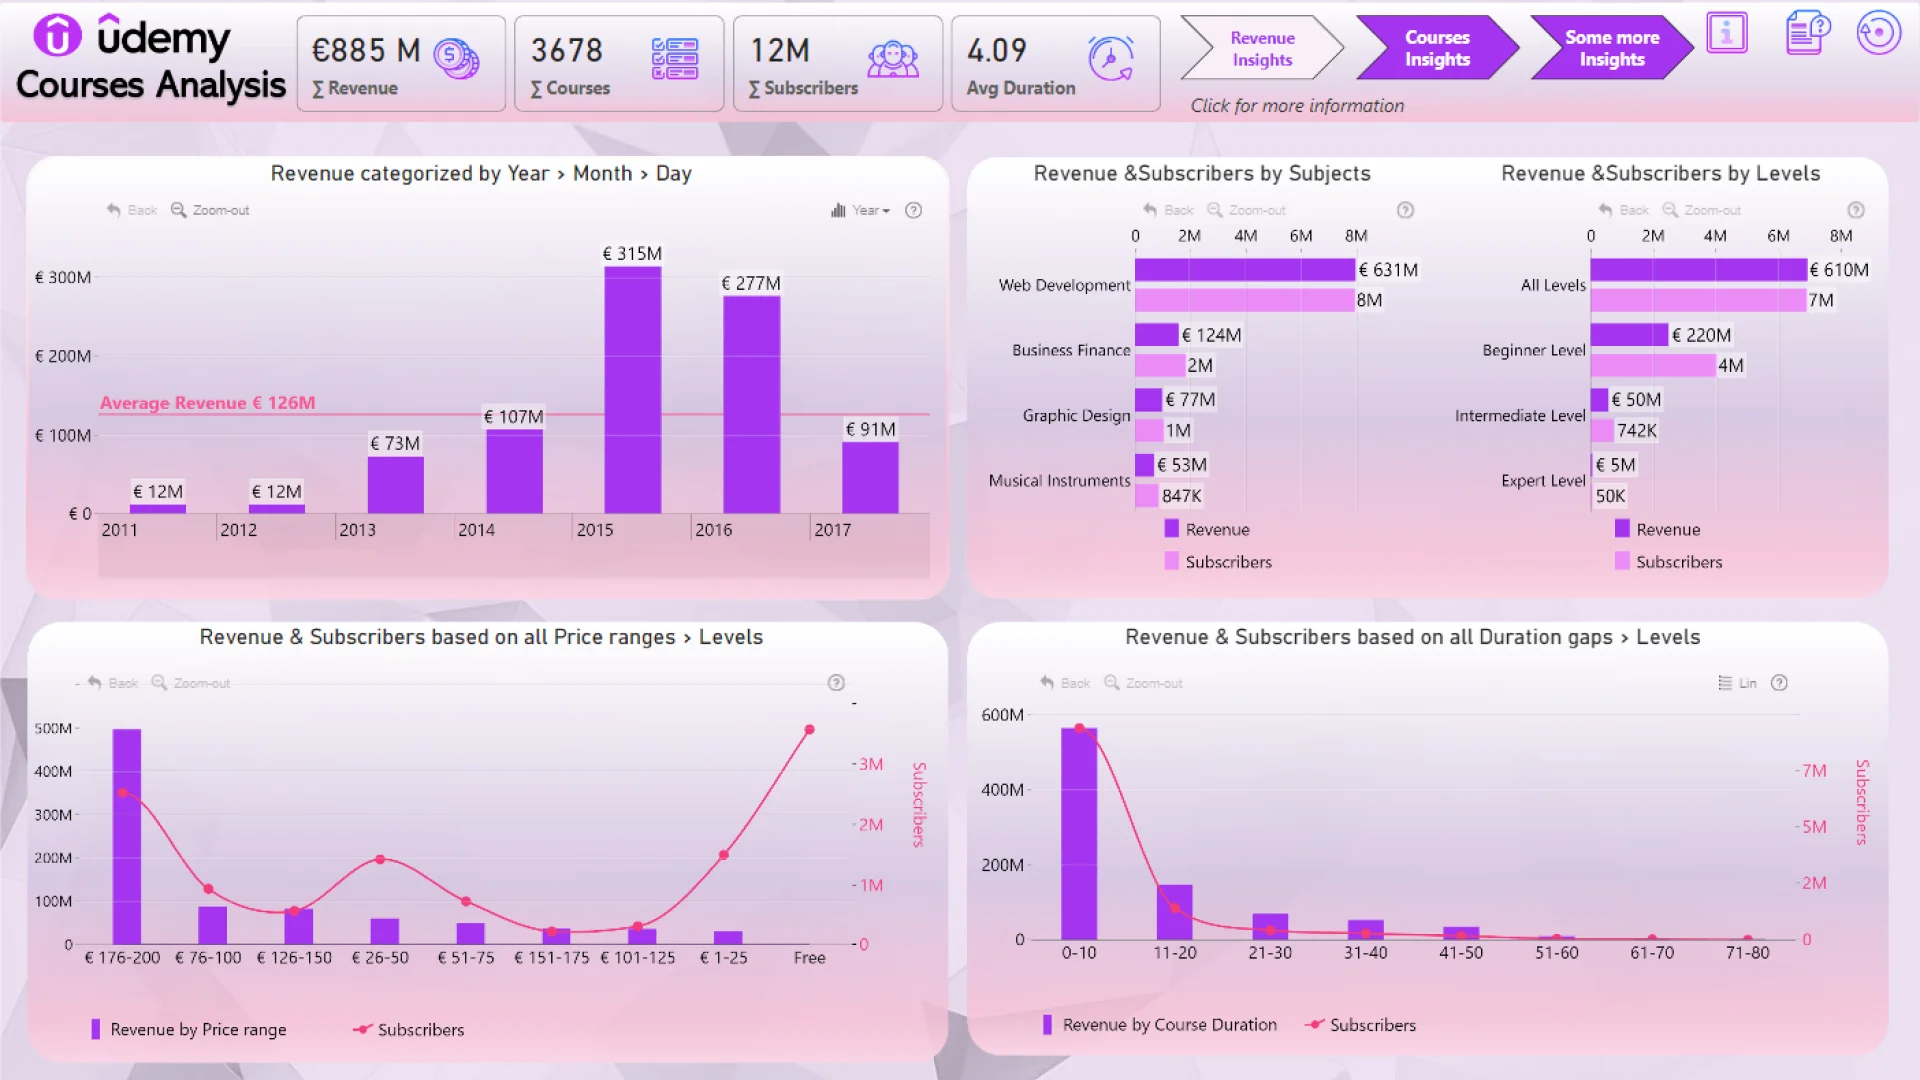
Udemy Course platform is starting work at 2010 year. Its popularity grew over the years. The Udemy platform provides 4 levels of courses: All levels, Beginner level, Intermediate level and Expert level. Courses are divided into four subjects: Web Development, Business Finance, Graphic Design and Musical Instruments.
1. The total revenue for 7 years is 885 million EUR with total subscribers 12 million and total courses 3678. The biggest revenue was at 2015 year – 315 million. EUR.
2. Customers choose courses categorized as 'All levels.' Over all the years, it amounted to 610 million EUR, including 1929 courses with 7 million subscribers.
3. The most popular course subject over the years is Web Development with revenue 631 mlj. EUR and 1200 courses with 8 million. of subscribers.
4. Subscribers prefer shorter courses – up to 10 hours in duration, but very informative, with good content and most expensive price range - 176-200 Eur. The total revenue for this course is 497 million EUR and 3 million subscribers.
5. Most courses are created in the price range of 26-50 EUR (1050) and 1-25 EUR (984). So it is worth creating more expensive courses with good content as they are very popular.
6. The Udemy platform provides both paid and free courses. The most quantity of courses was paid - 91.57 % ,3368 versus free courses contains only 8.43%, 310. But free courses have 1/3 of all subscribers – 4 million.
7. The highest-grossing course from the paid group is 'The Web Development Bootcamp' – 24,317 EUR.
8. The most popular course by subscribers from the free group is 'Learn HTML Programming from Scratch' – 269K.
ZoomCharts visuals used
Mobile view allows you to interact with the report. To Download the template please switch to desktop view.
