Feel free to leave your vote:
0
Share template with others
Summary
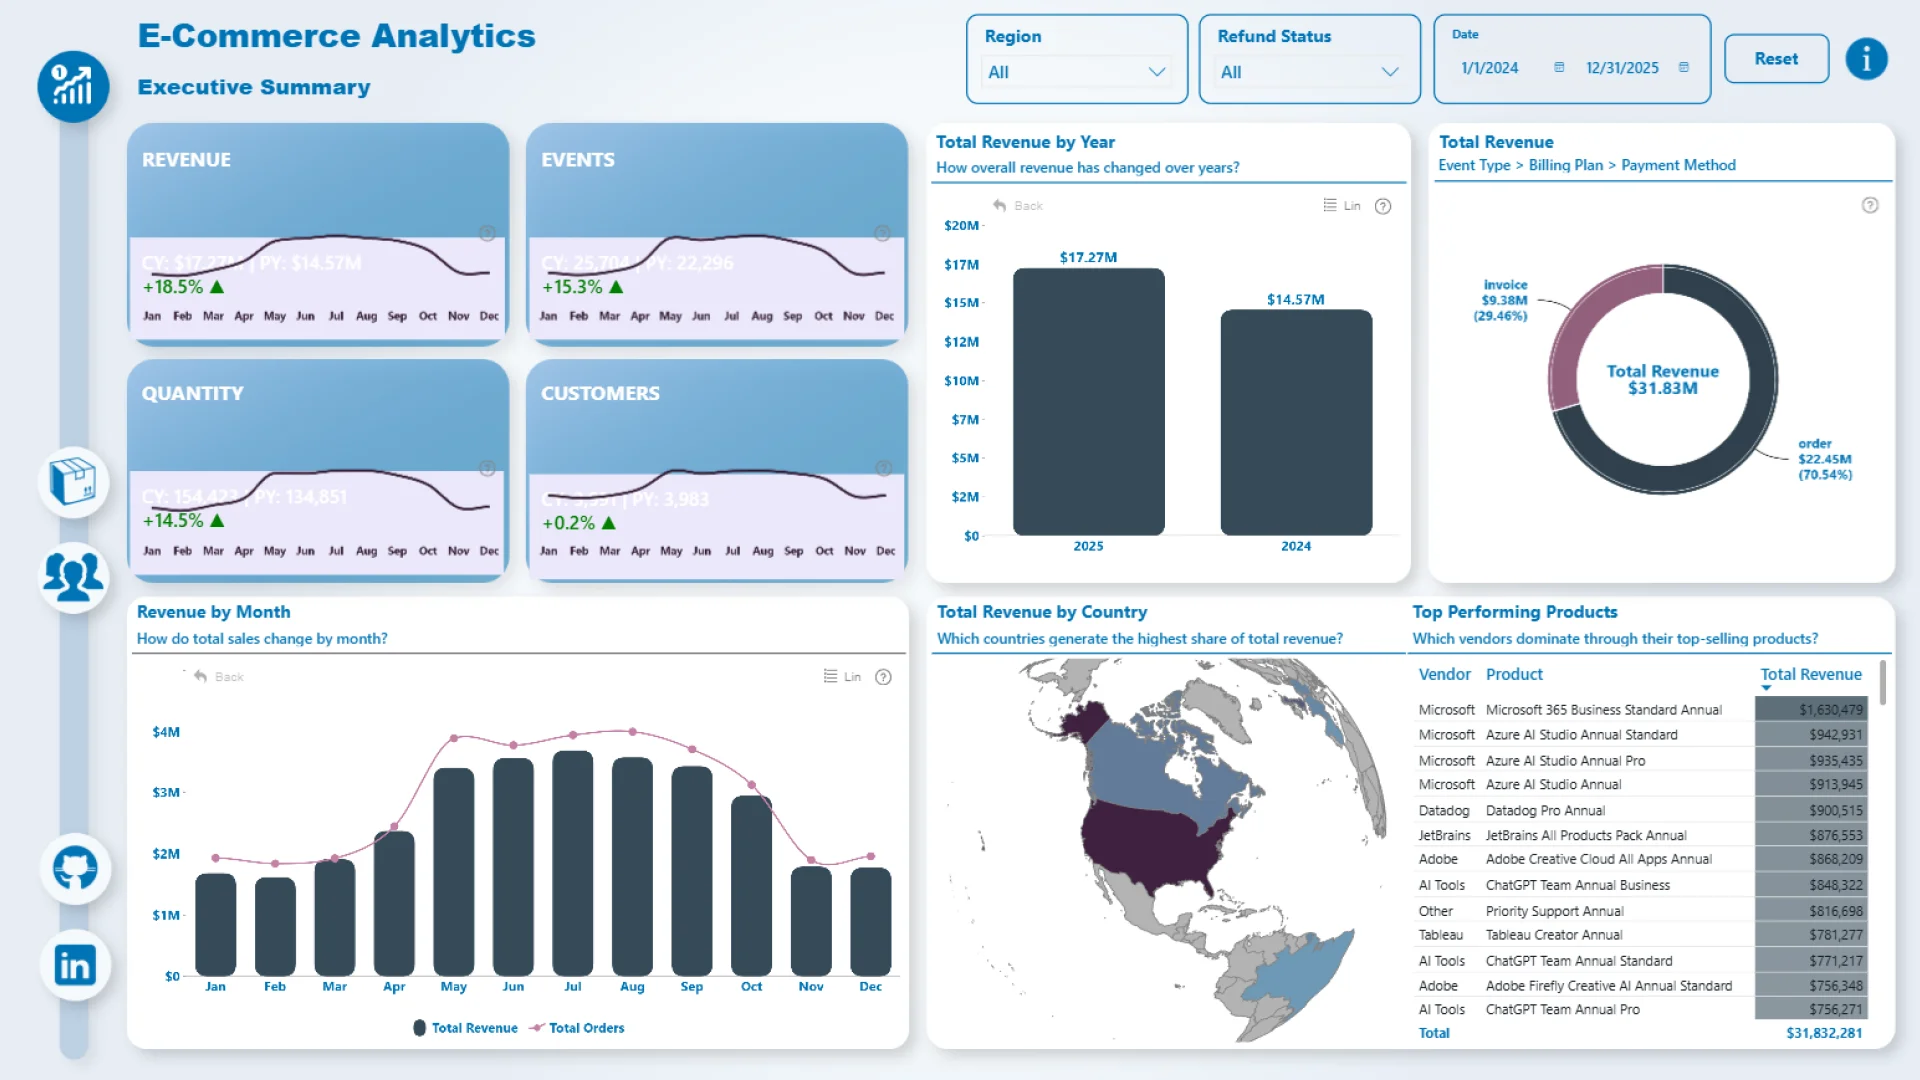
This Power BI report uses the e-commerce sales dataset from a global software retailer that sells subscriptions and add-ons across analytics, design, collaboration, and AI. The report features ZoomCharts Drill Down PRO custom visuals for Power BI. It was submitted to the Onyx Data DataDNA ZoomCharts Mini Challenge in October 2025.
Author description:
I analyzed e-commerce sales data from a global software retailer to understand customer loyalty and uncover which months, channels and segments drive most revenue.
Mobile view allows you to interact with the report. To Download the template please switch to desktop view.