Feel free to leave your vote:
4
Share template with others
Summary
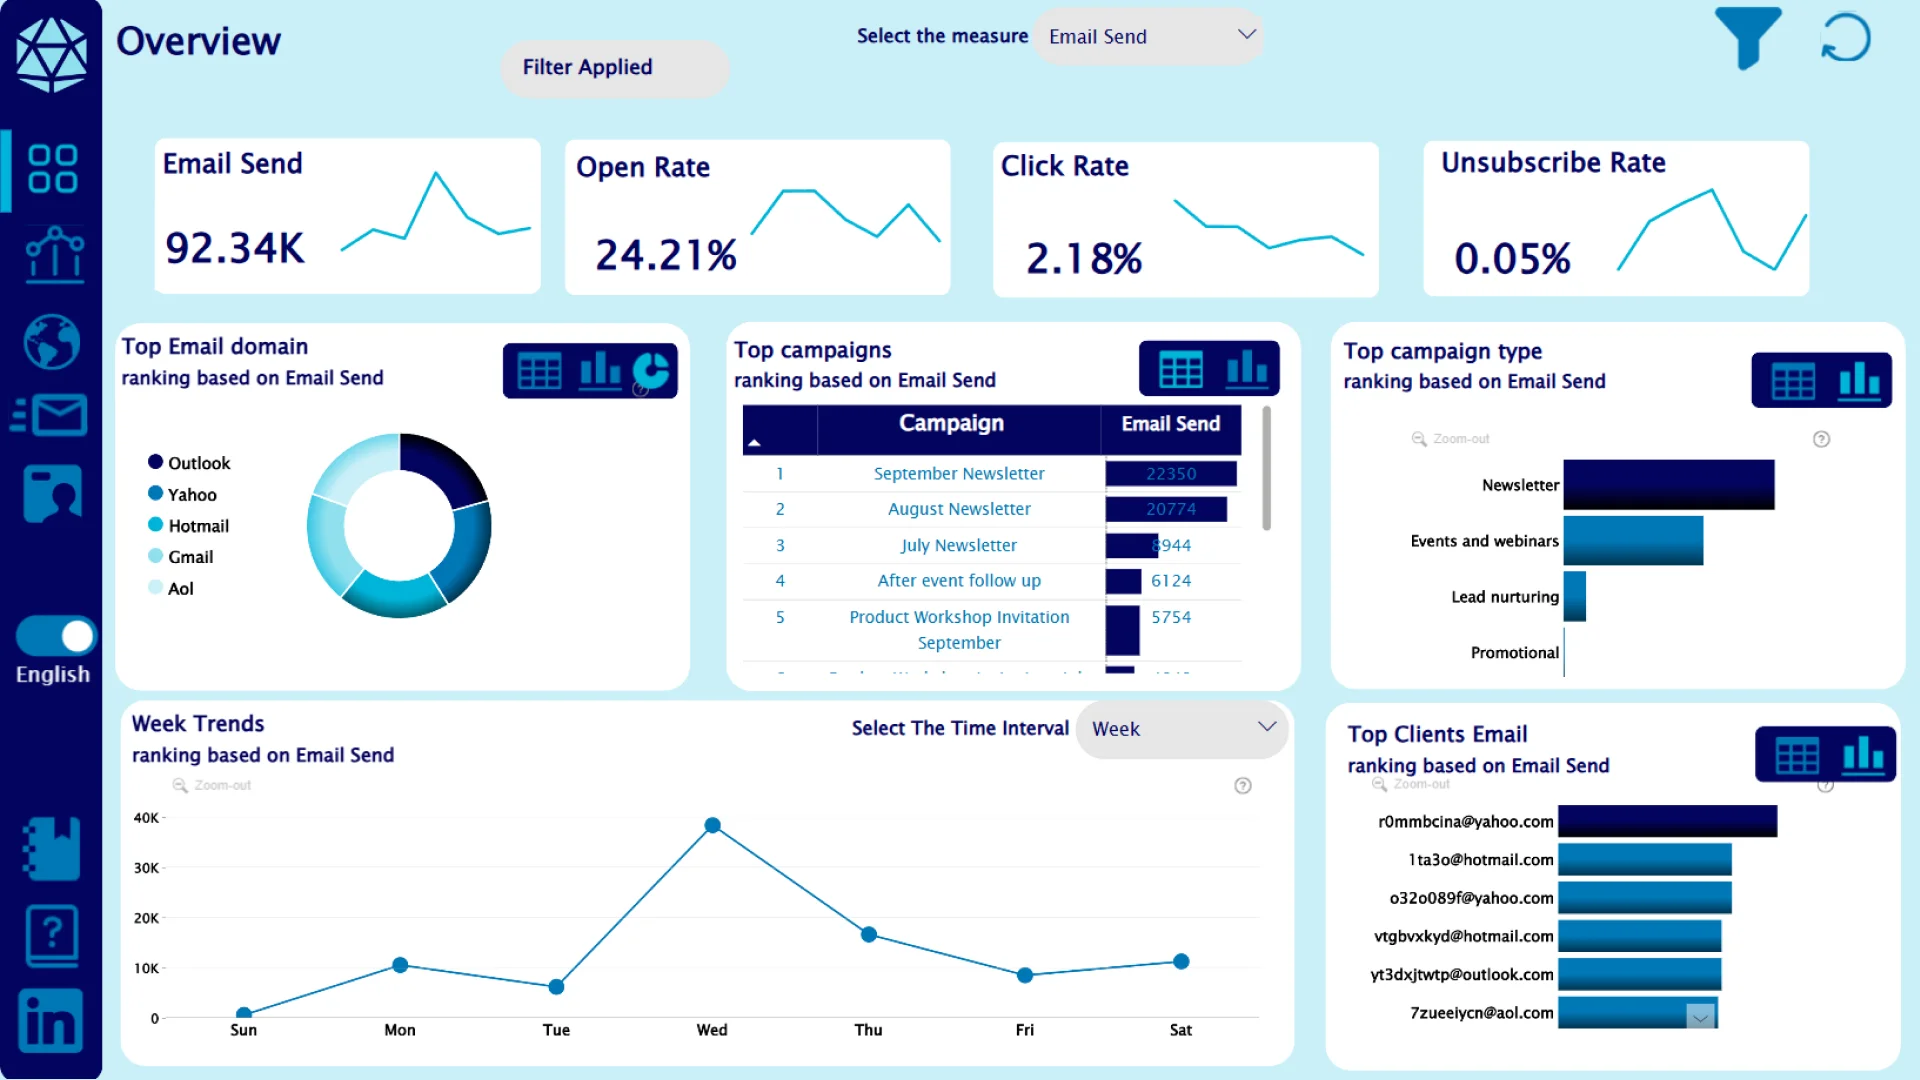
Report submitted for the FP20 Analytics ZoomCharts Challenge, October 2024. The report was built using the Marketing Email Campaign performance dataset and includes ZoomCharts custom Drill Down PRO visuals for Power BI.
Author's description: Explore an in-depth analysis of email campaign performance, featuring key metrics such as click rates, open rates, conversion rates, and bounce rates. Seamlessly switch between English and Español to view insights in your preferred language.
ZoomCharts visuals used
Mobile view allows you to interact with the report. To Download the template please switch to desktop view.