Feel free to leave your vote:
2
Share template with others
Summary
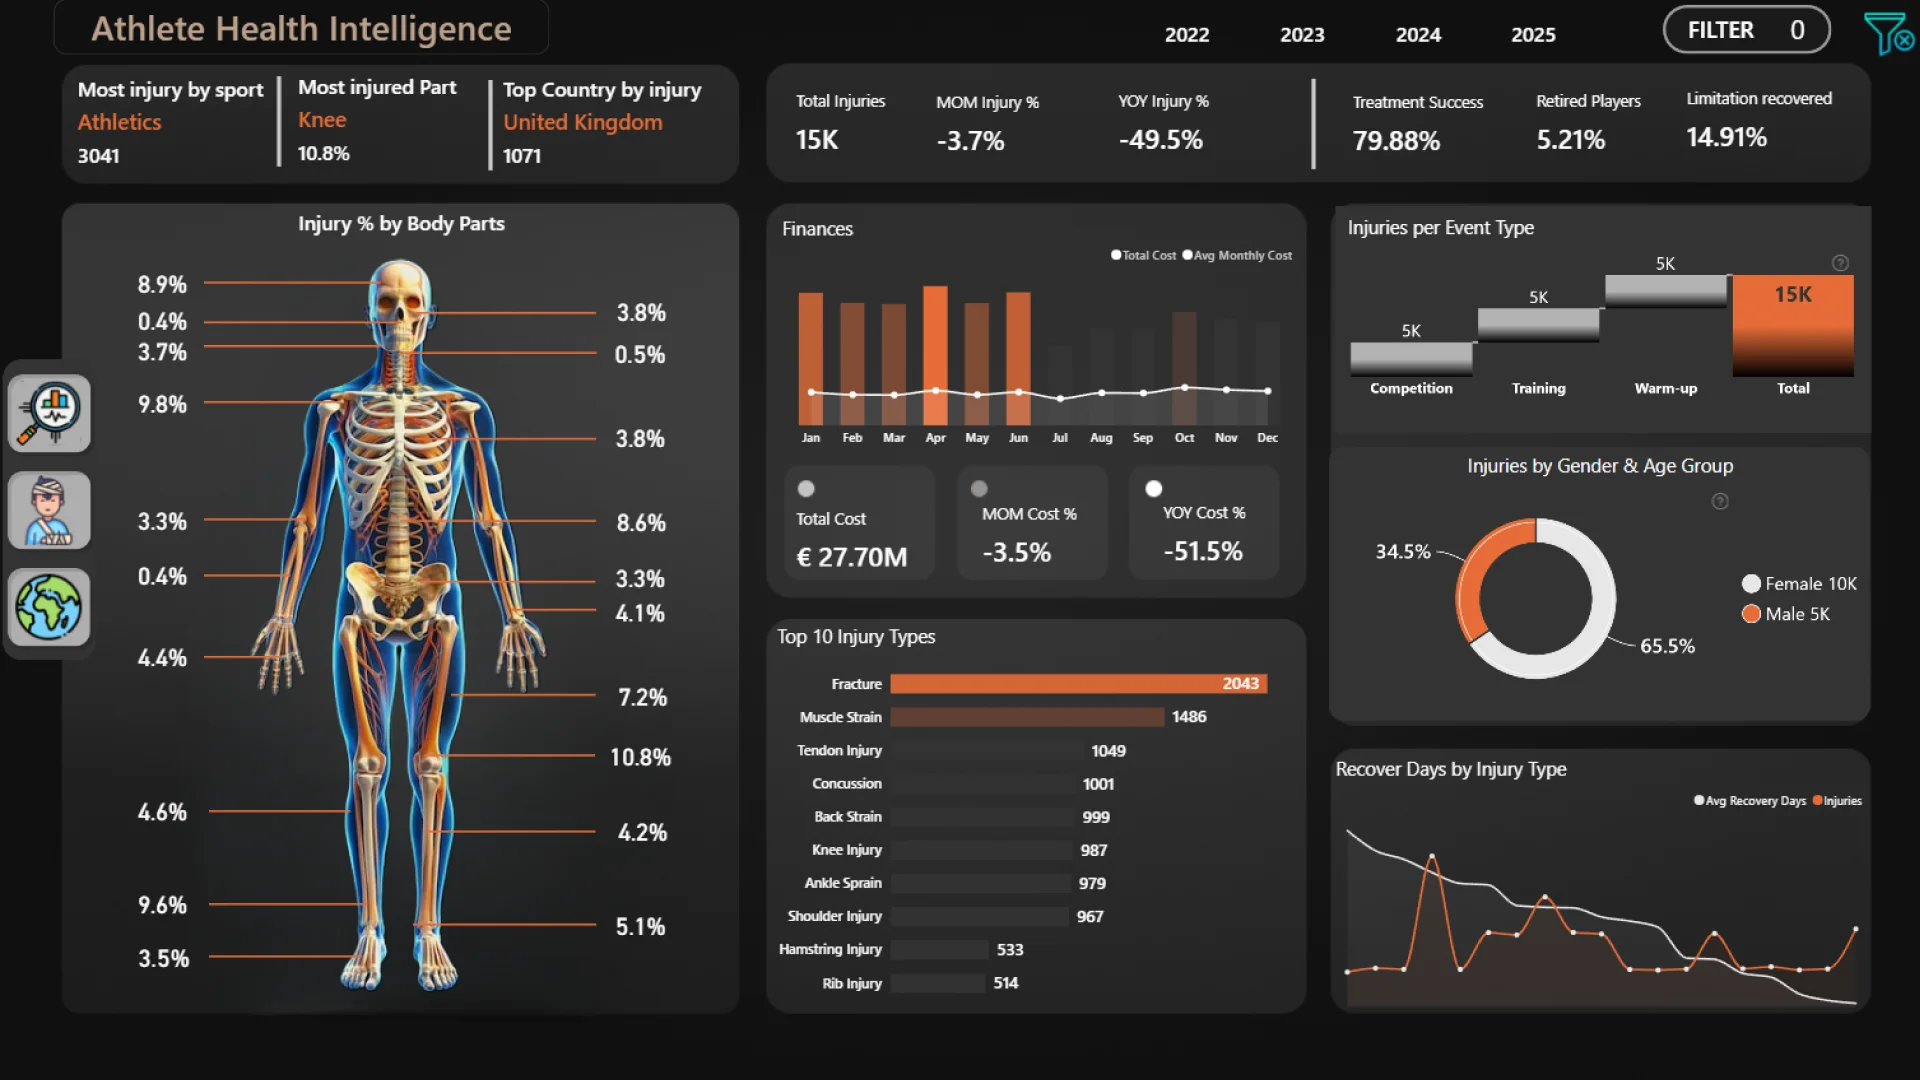
This Power BI report uses the Athlete Health and Injury dataset and features ZoomCharts Drill Down PRO custom visuals for Power BI. It was submitted to the FP20 Analytics ZoomCharts Data Challenge in August 2025.
Author's Description:
I built a Power BI report that dives into: - Injury trends highlight peak recovery delays during certain events. - Some coaches consistently have shorter recovery times, hinting at effective training methods. - Specific injury types (e.g., hamstring, ankle) are recurring and need targeted prevention. - Athletes with repeated injuries can be flagged early for proactive care. 🛠 Tools Used: Power BI ZoomCharts Custom Visuals Dynamic filtering & geo-mapping DAX for SLA analysis & resolution KPIs.
Mobile view allows you to interact with the report. To Download the template please switch to desktop view.