Feel free to leave your vote:
33
Share template with others
Summary
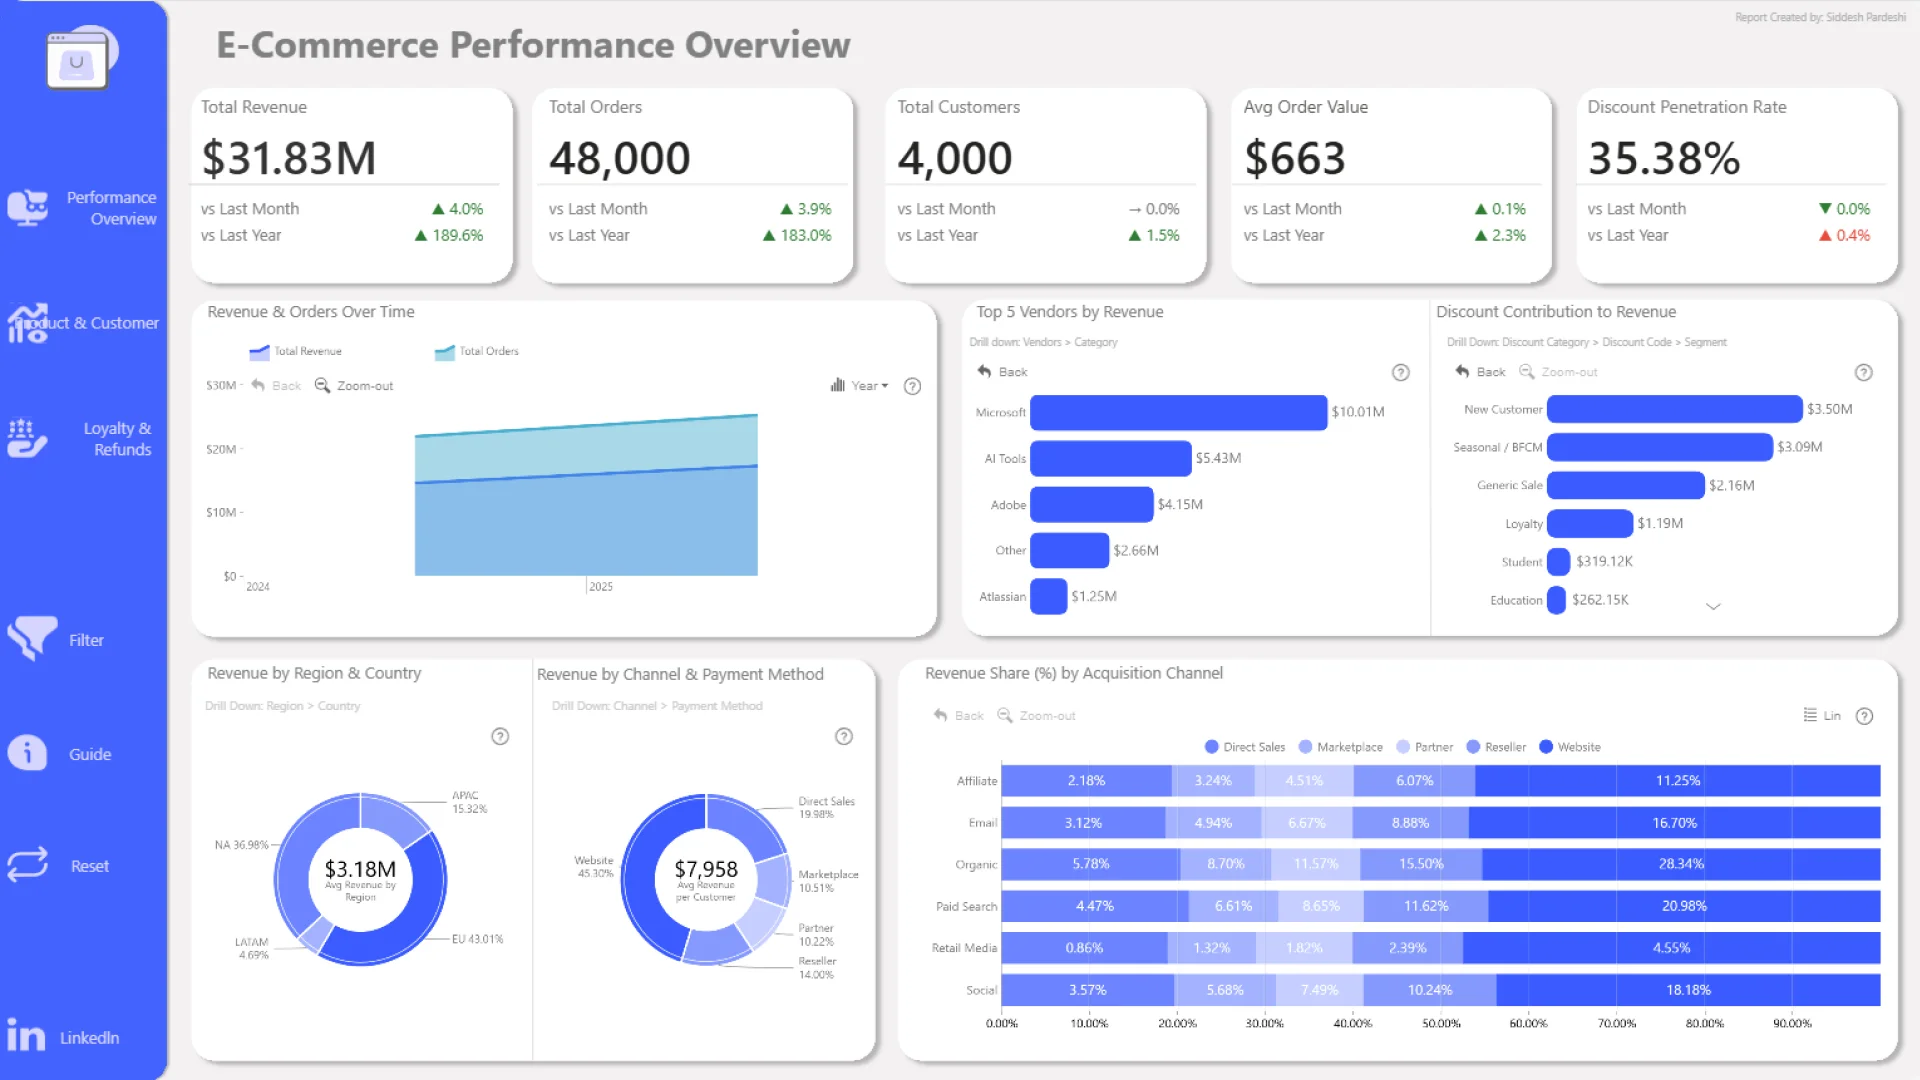
This Power BI report uses the e-commerce sales dataset from a global software retailer that sells subscriptions and add-ons across analytics, design, collaboration, and AI. The report features ZoomCharts Drill Down PRO custom visuals for Power BI. It was submitted to the Onyx Data DataDNA ZoomCharts Mini Challenge in October 2025.
Author description:
This dashboard provides a clear and simple view of e-commerce performance. It highlights key metrics such as revenue, customer behavior, product trends, refunds, and loyalty patterns. The visuals are easy to explore and allow users to drill deeper into specific areas without complexity. The purpose is to help anyone quickly understand what’s happening in the business, identify important changes, and make confident, data-driven decisions.
ZoomCharts visuals used
Mobile view allows you to interact with the report. To Download the template please switch to desktop view.