Feel free to leave your vote:
1
Share template with others
Summary
Report submitted for FP20 Analytics ZoomCharts Challenge 14 (March 2024). The report was built with the National Fuel Market Analysis dataset and includes ZoomCharts custom Drill Down PRO visuals for Power BI.
Author's description:
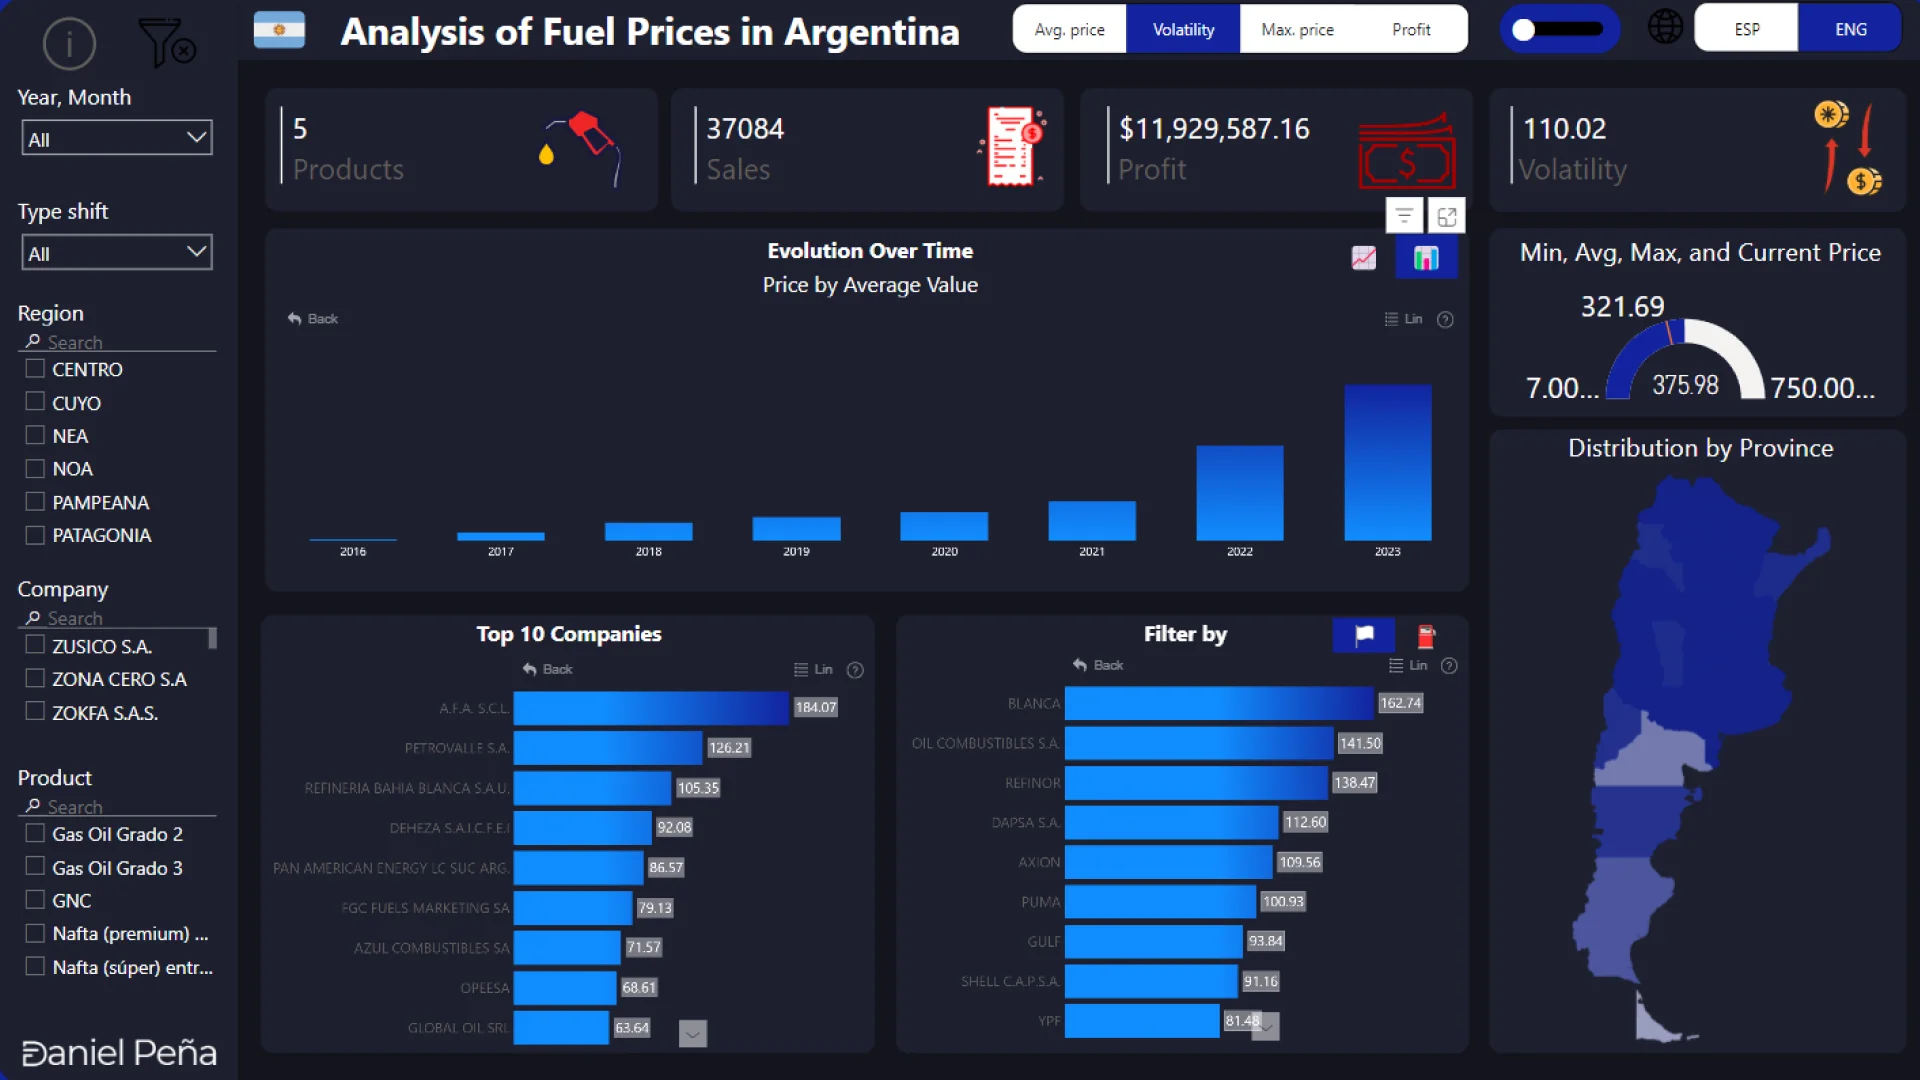
I embraced the challenge of creating visualizations as simple and clear as possible 🎯, achieving a result that truly satisfies. My goal was to answer all relevant questions with the minimum necessary visual elements 📊. The dashboard transforms the way we interact with information, offering a unique experience where it features:
- 🌐 Maximum personalization: Change the report language to your preference.
- 🔍 Precision deepening: Intuitive filters for detailed analysis.
- 📈 Dynamic data view: Choose between key metrics such as maximum price, average, total sales, and volatility, to visualize their real-time evolution, geographic impact, and by company/product.
- 📉 Comprehensive analysis at a glance: A special chart reveals the average, maximum, minimum, and current prices.
- 🌓 Visual flexibility: Toggle between dark and light mode for a personalized experience. This project is more than a dashboard; it is an empowerment tool that answers complex questions with visual simplicity.
Mobile view allows you to interact with the report. To Download the template please switch to desktop view.