Feel free to leave your vote:
0
Share template with others
Summary
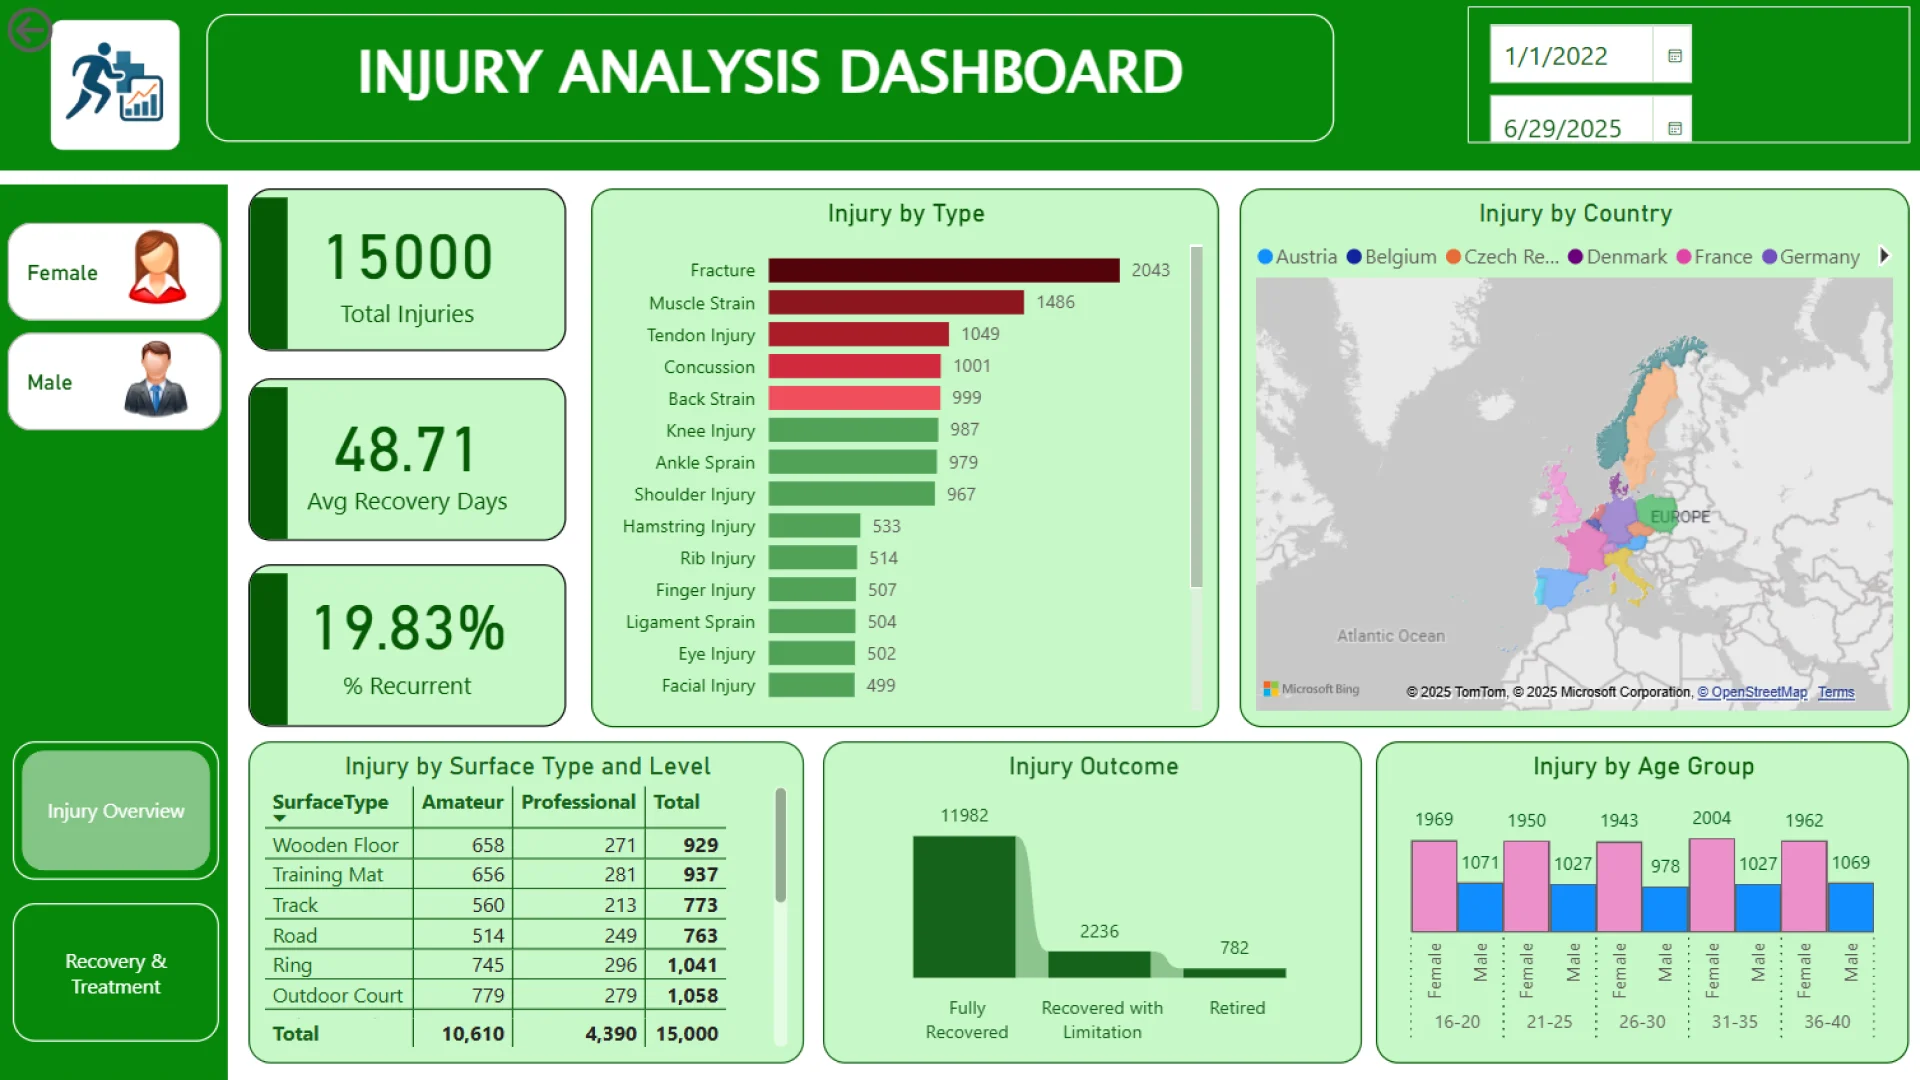
This Power BI report uses the Athlete Health and Injury dataset and features ZoomCharts Drill Down PRO custom visuals for Power BI. It was submitted to the FP20 Analytics ZoomCharts Data Challenge in August 2025.
Author's Description:
For the FP20 August Challenge, I designed an interactive Power BI dashboard with clear visuals and intuitive navigation, focusing on actionable insights. The layout balances aesthetics with functionality, ensuring data storytelling is both engaging and easy to follow. I also integrated two ZoomCharts visuals to enhance interactivity and user engagement.
Mobile view allows you to interact with the report. To Download the template please switch to desktop view.