Feel free to leave your vote:
0
Share template with others
Summary
Report submitted for FP20 Analytics ZoomCharts Challenge 14 (March 2024). The report was built with the National Fuel Market Analysis dataset and includes ZoomCharts custom Drill Down PRO visuals for Power BI.
Author's description:
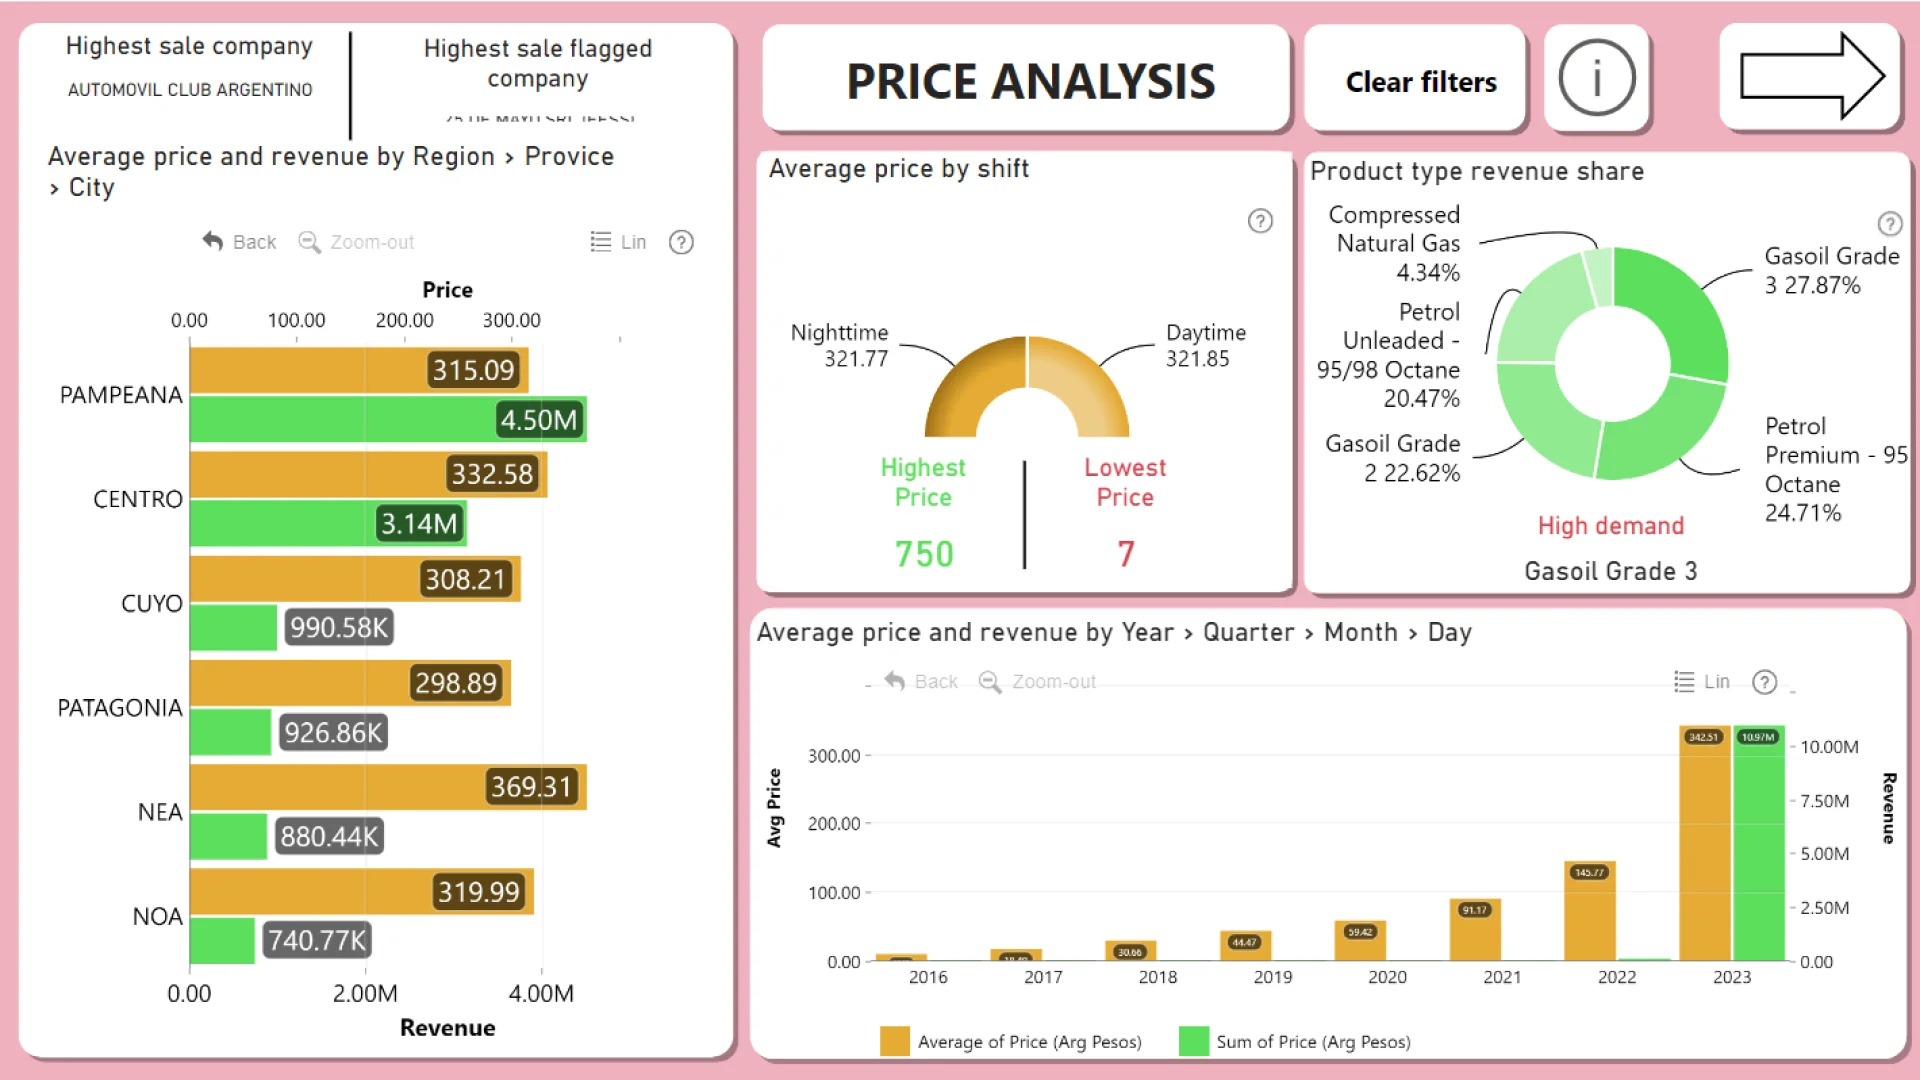
As I dive in to the dataset I have discovered some insight:
- Huge increase in fuel price in 2022 and 2023 due to pandemic, wars, economic crisis, In most regions Gasoil Grade 3 and Petrol Premium 95 Octane 24.71% have highest revenue share, little difference in price by shifts.
- Price have tendency to increase around quarter 3,4 due to increase in demand (In most case both Price and Revenue largely increase around quarter 3,4) - In most of regions and cities price and revenue have negative relationship (the higher the price the lower the revenue and reversed).
- The revenue and price (Price represented by the size of circle) is much higher at the East where the trading of fuel with countries that high export of fuel is highest.
- Fuel sellers in the East have slow price increase rate due to high demand than the other sellers.
- Seller in the South have lowest revenue and average price due to the geographical disadvantage.
- The general trend is lower revenue/price coming to Southern part and higher when coming to Eastern and Southern part.
ZoomCharts visuals used
Mobile view allows you to interact with the report. To Download the template please switch to desktop view.