Feel free to leave your vote:
4
Share template with others
Summary
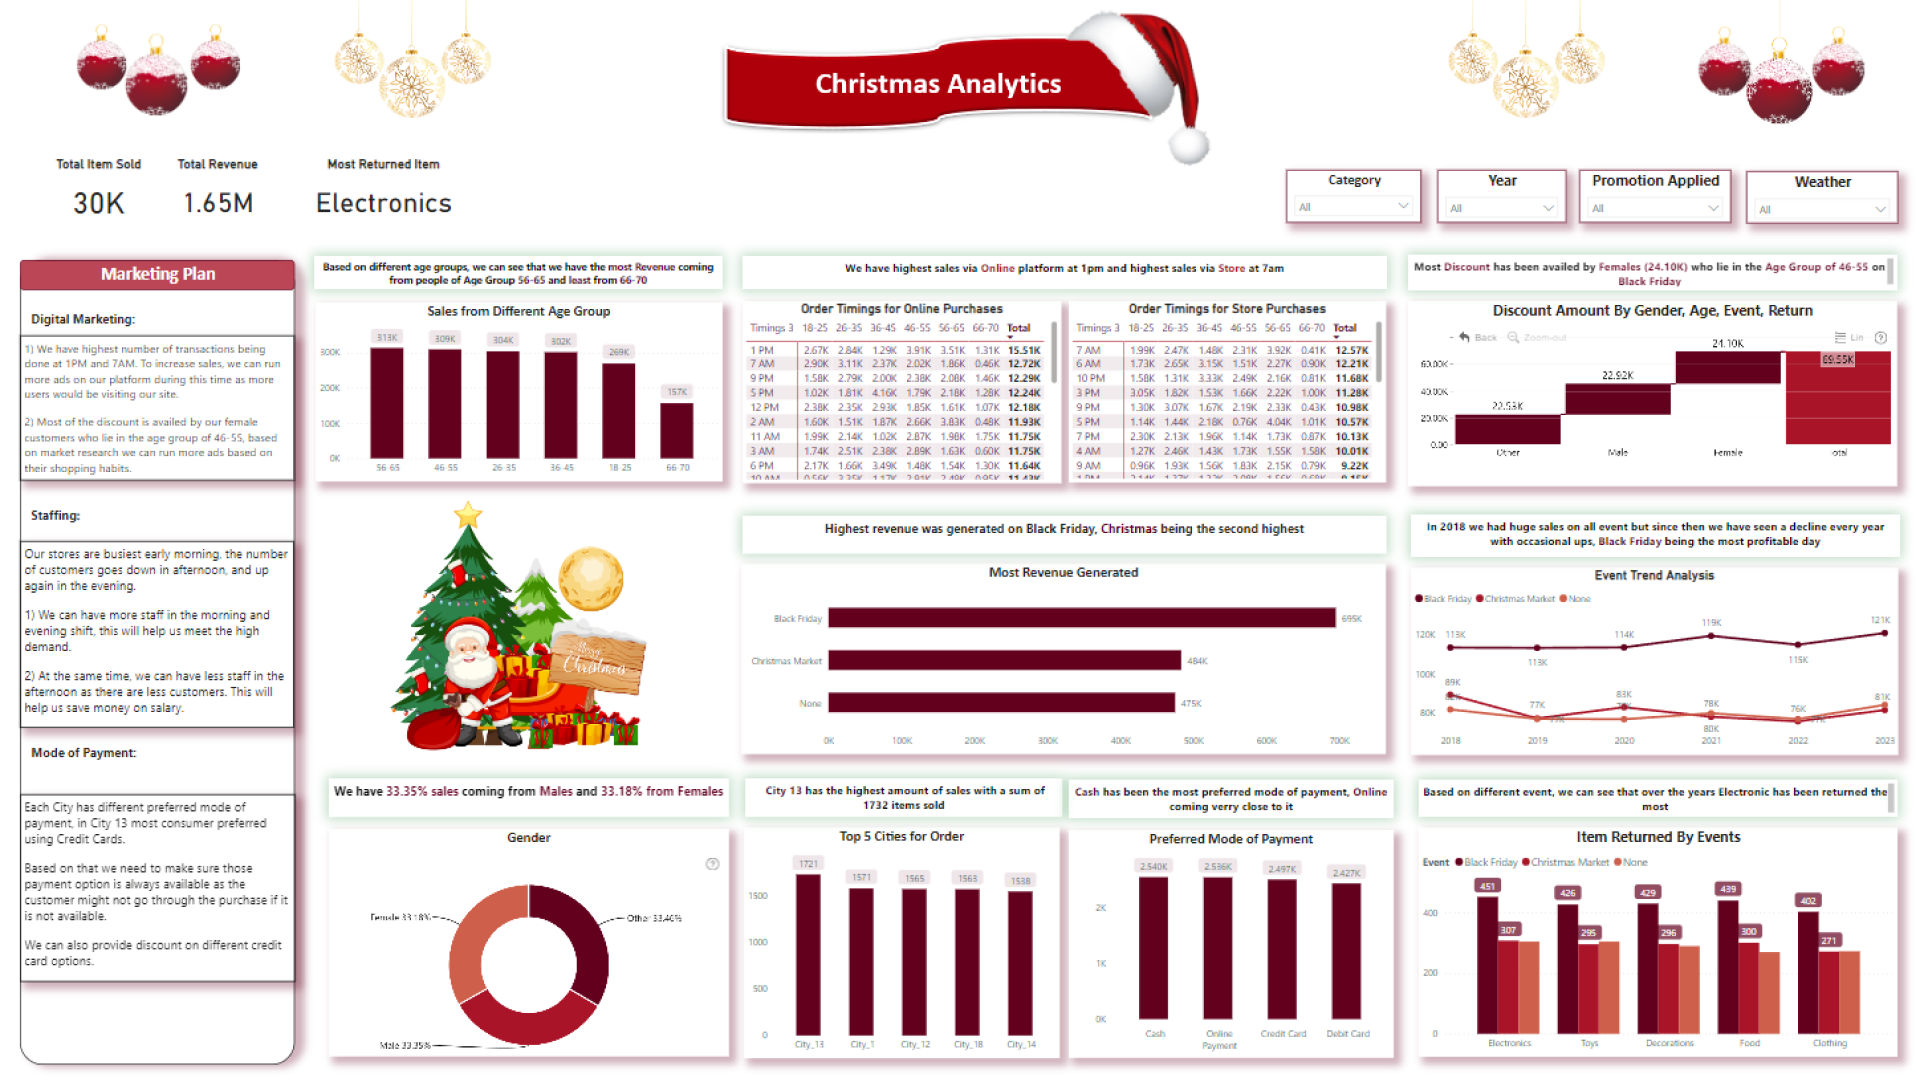
Report submitted for Onyx Data DataDNA ZoomCharts Mini Challenge, December 2023. The report was built based on Christmas Sales and Trends dataset and includes ZoomCharts custom Drill Down PRO visuals for Power BI.
Author's description:
This submission is part of Christmas and sales trends by Onyx Data Challenge. For ZoomCharts Mini Challenge I have used Donut and Waterfall Drill Down Chart. The Waterfall chart is used to show Discount Amount based on Gender, Age, Event and how many of those availed discounted items have been returned. The Donut Chart is used to show sales from different Genders.
Mobile view allows you to interact with the report. To Download the template please switch to desktop view.